

A quadratic graph represents the visual shape of a quadratic function, which is a polynomial of degree 2.
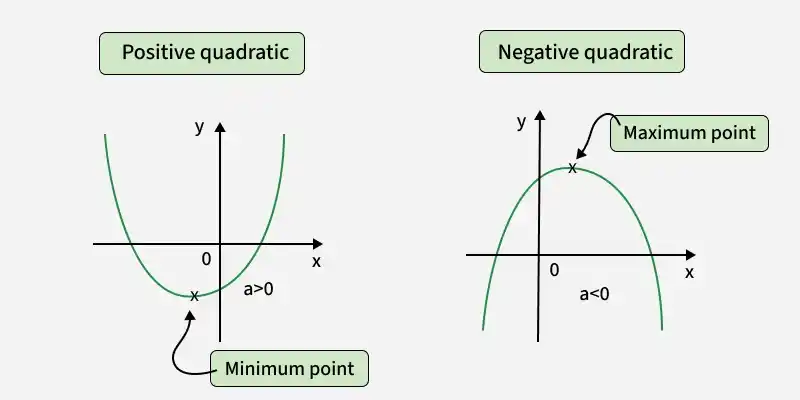
The graph of the function is called a parabola, a U-shaped curve that can open upwards or downwards depending on the sign of the coefficient a.
- If a > 0, the parabola opens upwards and has a minimum point.
- If a < 0, the parabola opens downwards and has a maximum point.
Some important characteristics of a quadratic graph are:
- It is symmetric about a vertical line called the axis of symmetry.
- It has a turning point called the vertex.
- It may intersect the x-axis at zero, one, or two points.
- It always intersects the y-axis once.
Key Features
Some of the key features of quadratic graphs are:
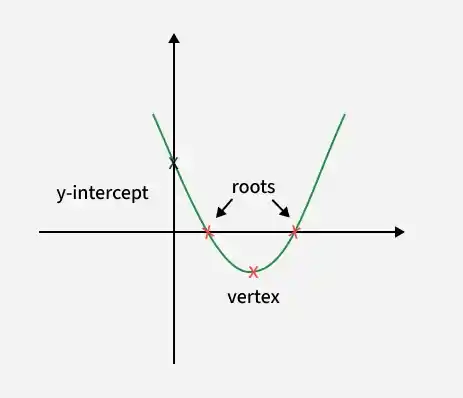
1. Vertex of the Quadratic Graph: The vertex of the quadratic graph is the highest or lowest point on the parabola depending on its orientation. For the function f(x) = ax2 + bx + c the vertex can be found using the formula:
x = -b / (2a)
Substitute this x value into the function to the find the corresponding y value. The vertex is given by:
Vertex = (-b / (2a) , f(-b / (2a))
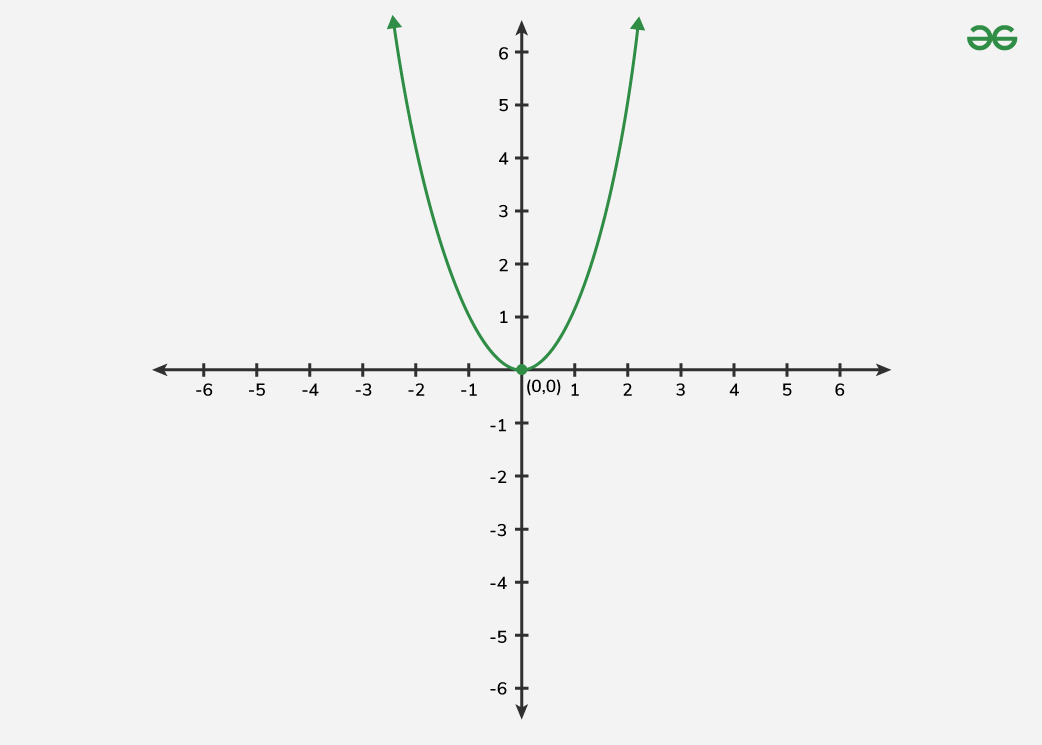
Example: For the quadratic function f(x) = x2:
- Find the x-coordinate of the vertex:
x = \frac{-b}{2a} = \frac{-0}{2 \cdot 1} = 0 - Find the y-coordinate of the vertex by the substituting x=0 into the function: f(0) = 02 = 0
- So, the vertex is (0,0).
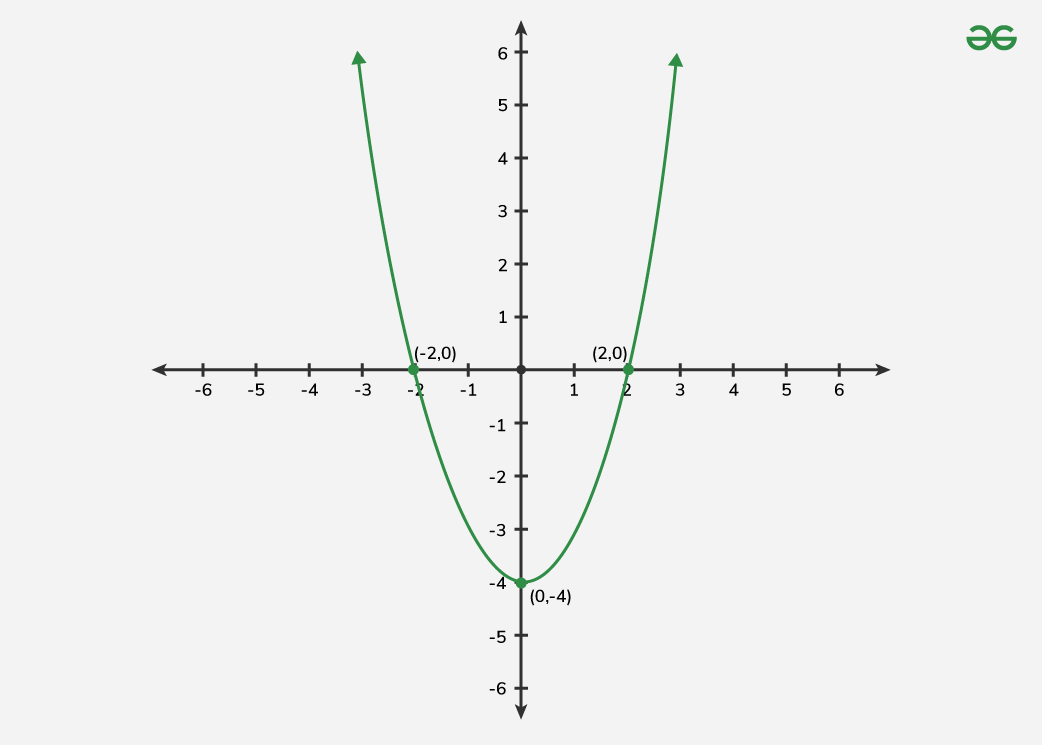
2. Axis of Symmetry: The axis of symmetry is a vertical line that passes through the vertex and divides the parabola into the two mirror-image halves. It has the equation:
x = -b / (2a)
Example: For the function f(x) = x2 − 4:
- Find the x-coordinate of the axis of the symmetry:
x = \frac{-b}{2a} = \frac{0}{2 \cdot 1} = 0 - The axis of the symmetry is x = 0.
3. Direction of Opening :The direction in which the parabola opens depends on the coefficient a:
- If a > 0 the parabola opens upwards.
- If a < 0 the parabola opens downwards.
Example: For the function f(x) = x2:
Check the coefficient a:
- Here, a = 1 which is positive.
Thus, the parabola opens upwards.
4. X-Intercepts and Y-Intercepts
- X-Intercepts are the points where the graph intersects the x-axis. Set f(x) = 0 and solve for the x.
- Y-Intercept is the point where the graph intersects the y-axis. Set x = 0 in the function:
Y - Intercept = f(0) = c
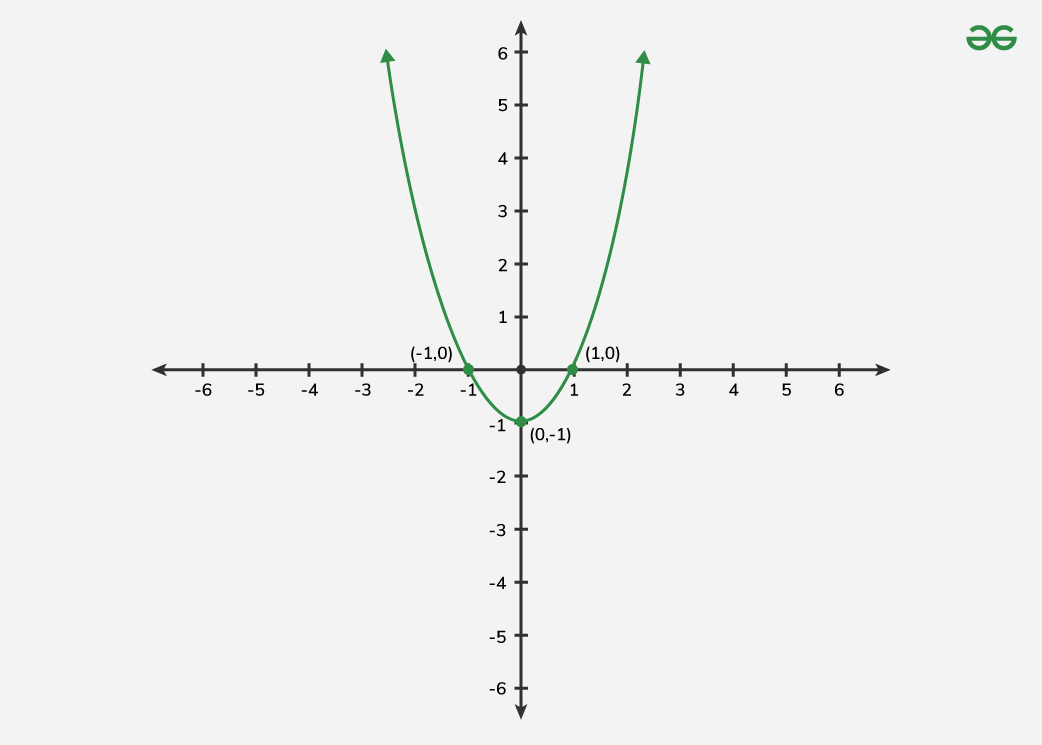
Example: For the function f(x) = x2 − 1:
Find the x-intercepts:
- Set f(x) = 0: x2 − 1 = 0
- Factor the quadratic equation:(x − 1)(x + 1) = 0
- Solve for the x: x = 1 or x = −1
- The x-intercepts are (1, 0) and (−1, 0).
Find the y-intercept:
- Set x = 0: f(0) = 02 − 1 = −1
- The y-intercept is (0,−1).
Plotting a Quadratic Graph
Steps to plot quadratic graph are:
Step 1. Find the Vertex using the vertex formula.
Step 2. Determine the Axis of the Symmetry.
Step 3. Find the X-Intercepts by the solving ax2 + bx + c = 0.
Step 4. Find the Y-Intercept by the setting x = 0.
Step 5. Plot the Vertex, Intercepts and Additional Points if needed.
Step 6. Draw the Parabola through these points.
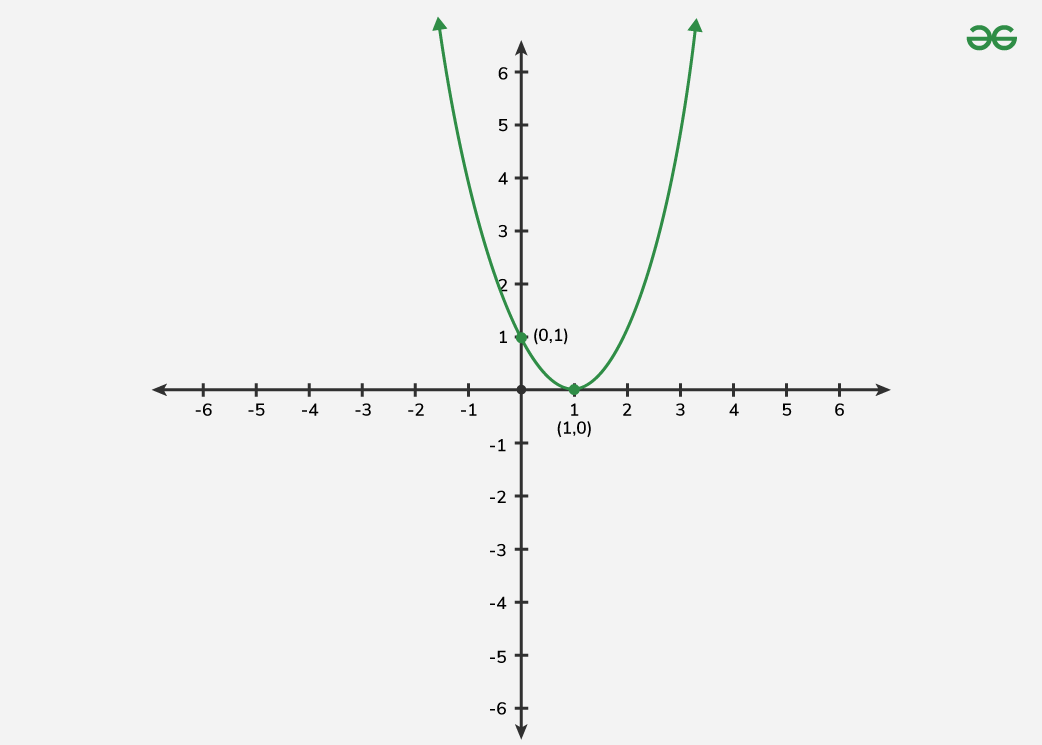
Example: For the quadratic function f(x) = x2 − 2x + 1
- Vertex: (1, 0)
- X-Intercepts: (1, 0)
- Y-Intercept: (0, 1)
➢Practice: Solved Examples
