A quadratic graph is the graph of a quadratic function of the form y = ax² + bx + c (where a ≠ 0). It is a U-shaped curve called a parabola that opens upward if a is positive and downward if a is negative.
Solved Examples
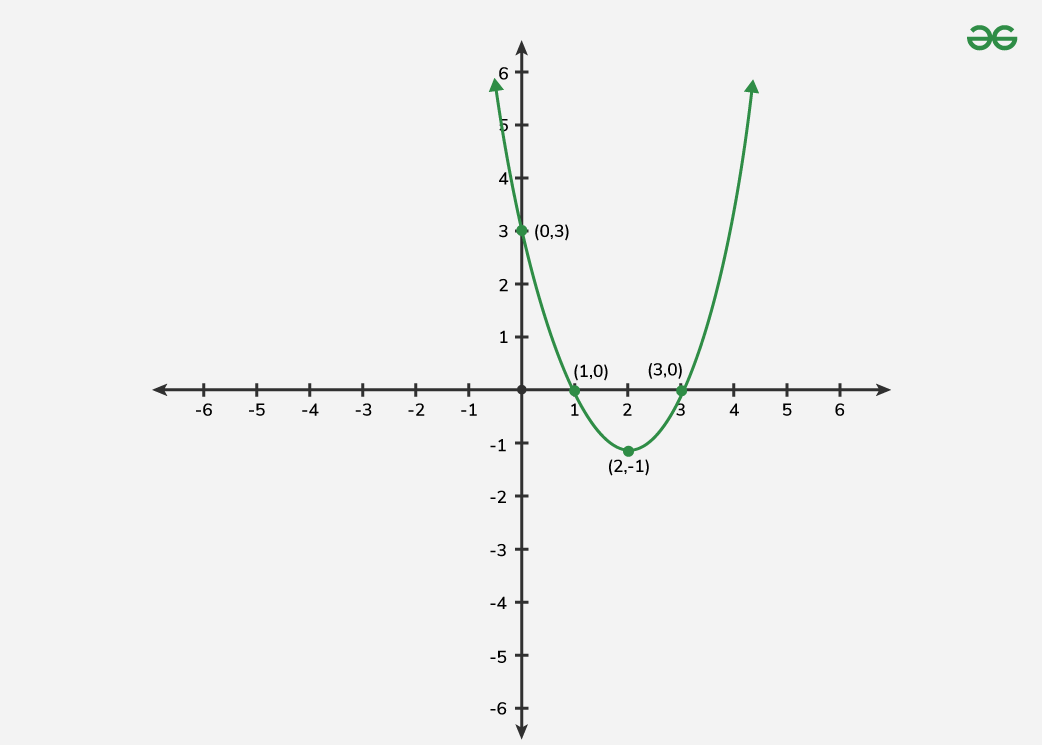
Example 1: Graph: f(x) = x2 - 4x + 3
Vertex Calculation:
a = 1, b = -4, c = 3
Vertex x value: x = -\frac{-4}{2 \times 1} = 2 Vertex y value: f(2) = 22- 4 **2 + 3 = -1 Vertex: (2, -1)
Axis of Symmetry: x = 2 Y-intercept: f(0) = 3 X-intercepts: Solve x2 - 4x + 3 = 0 (x - 1)(x - 3) = 0 X-intercepts: x = 1 and x = 3
Graph: Plot the vertex (2, -1) the y-intercept (0, 3) and x-intercepts (1, 0) and (3, 0). Draw the parabola opening upwards.
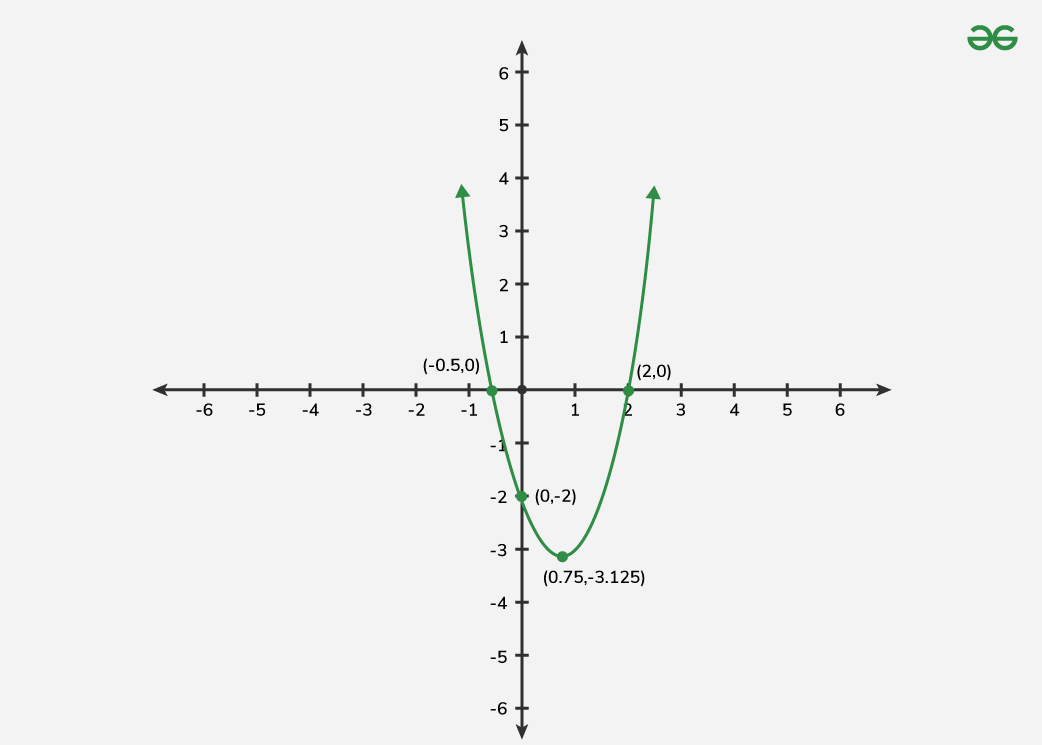
Graph:Plot the roots (2, 0) and \left(-\frac{1}{2}, 0\right) and the vertex \left(\frac{3}{4}, -\frac{25}{8}\right). Draw the parabola opening upwards.
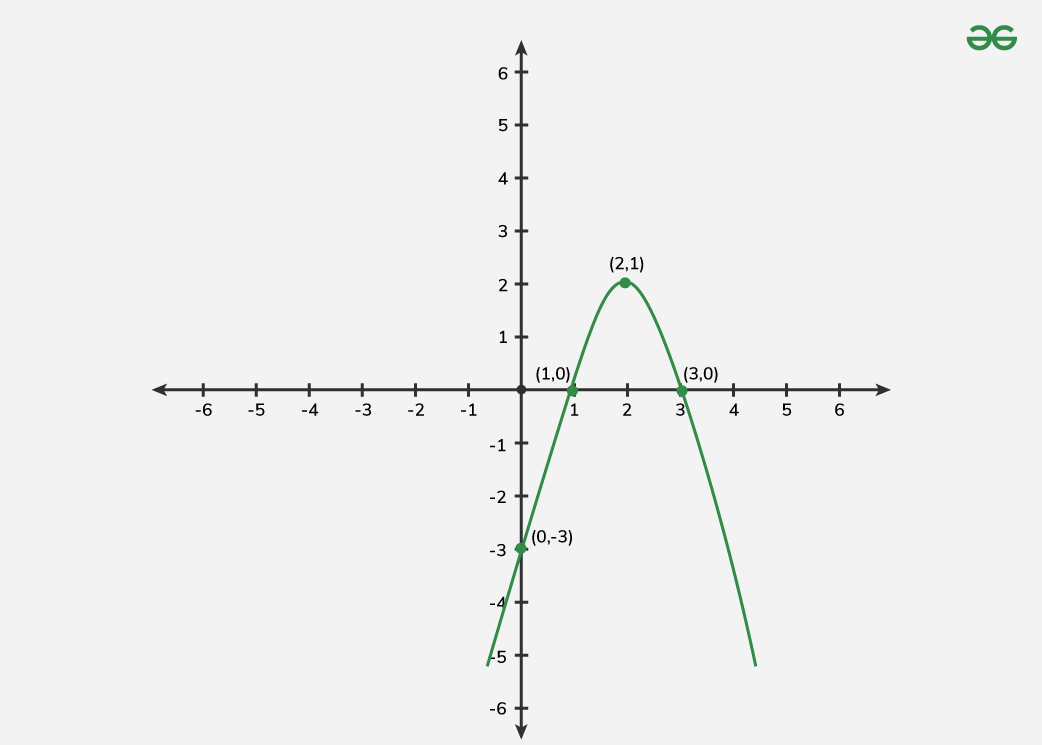
Example 3: Graph f(x) = -x2 + 4x - 3.
Vertex Calculation:
a = -1,
b = 4,
c = -3
Vertex x value: x = -\frac{4}{2 \times -1} = 2 Vertex y value: f(2) = -22 + 4 * 2 - 3 = 1 Vertex: (2, 1)