


 本文介绍了如何使用HTML和JavaScript在地图上创建跟随移动、缩放和旋转的扇形区域,包括数据定义、图形绘制方法和动态颜色设置的详细代码示例。
1.需求效果如下
画一个扇形或多个扇形组成圆,跟随地图移动、缩放、旋转等
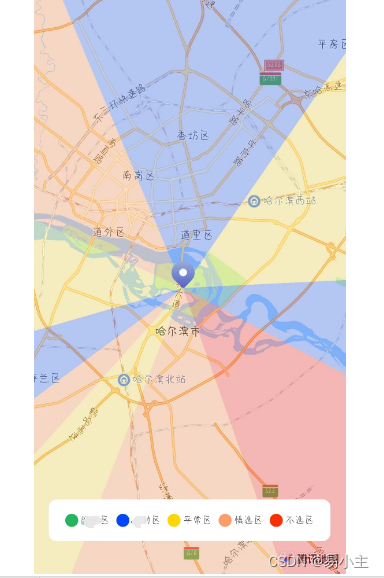
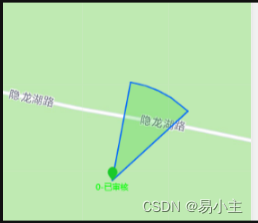
2.代码实现
HTML部分:
<map ref="map" style="width: 100%; height: 100%" :scale="12" :min-scale="5" :max-scale="15" :latitude="latitude" :longitude="longitude" :markers="covers" :polygons="polygons"></map>
JS部分:
定义数据:
data() {
			return {
				latitude: 28.2283, // 地图中心纬度
				longitude: 112.9389, // 地图中心经度
				covers: [{
					id: 10000,
					latitude: 28.2283, // 标记点纬度
					longitude: 112.9389, // 标记点经度
					width: 27,
					height: 31,
					iconPath: '../../static/report/mackerIcons.png'
				}],
				polygons: [],//自定义覆盖物
			}
		},
画图形方法,根据自己需要设置扇形角度,下面代码设置为30°
//angle初始角度,shifting旋转角度,ll中心经纬度
logPoint(angle, shifting, ll) {
				var lls = [];
				lls.push({
					longitude: ll.JD,
					latitude: ll.WD
				})
				var a = 4000000; //半径
				angle = angle - shifting > 0 ? angle - shifting : angle + (360 - shifting); //更具方位角算出,扇形弧边的初始位置。

				var b, c; // 边长,a是圆半径,b是高(Y轴),C是长(X轴)
				var B; // 角度,设定B是向量-变化
				for (var i = 0; i < 11; i++) {
					var g = angle + i * 3;
					g = g > 360 ? g - 360 : g;
					var B = g / (180 / Math.PI); //Math中使用的是弧度并不是角度,所以将角度转换成弧度(180/π)°角度
					b = a * Math.sin(B);
					c = a * Math.cos(B);
					// 1.同一纬线上经度差一度,实际距离差多少
					// 111km*cosφ (φ为当地纬度)
					// 2.同一经线上纬度差一度,实际距离差多少
					// 111km
					b = b / 111000 + ll.JD;
					c = c / 111000 + ll.WD;
					lls.push({
						angle: B,
						longitude: b,
						latitude: c,
					});
				}
				return lls;
			},
使用方法:
//colorValue动态设置颜色值,latitude中心经度, longitude中心纬度
countBear(colorValue, latitude, longitude) {
				let that = this
				var N = {
					points: that.logPoint(30, 45, {
						JD: longitude,
						WD: latitude,
					}),
					fillColor: that.changeColor(colorValue.N),
					strokeColor: "transparent",
					strokeWidth: 1,
					zIndex: 1
				};
				var ENN = {
					points: that.logPoint(30, 15, {
						JD: longitude,
						WD: latitude,
					}),
					fillColor: that.changeColor(colorValue.ENN),
					strokeColor: "transparent",
					strokeWidth: 1,
					zIndex: 1
				}
				//以此类推... 要几个扇形定义几个
				let pl = []
				pl.push(N, ENN, ...)
				that.polygons = pl //与map组件中的参数对应
			}

//动态设置颜色值方法 这里要注意只能用HEX不能用RGBA
changeColor(e) {
				return e == 2 ? '#24B65A3D' : (e == 1 ? '#0047FF40' : (e == 0 ? '#FFDF3640' : (e == -1 ? '#FF884540' : '#FF00003D')))
			},


 扫一扫
扫一扫


 7238
7238

 被折叠的 条评论
为什么被折叠?
被折叠的 条评论
为什么被折叠?
 到【灌水乐园】发言


