

Managing a library efficiently requires a structured system to organize books, track borrowings, and analyze user behavior. A well-designed Library Management System (LMS) simplifies these tasks by maintaining accurate records of books, borrowers, transactions, and fines, enabling better decision-making.
- Explains a library dataset schema with book, borrower, and transaction details.
- Covers essential attributes like genres, issue dates, return dates, and fines.
- Demonstrates Exploratory Data Analysis (EDA) using SQL queries.
- Extracts insights on borrowing patterns, overdue books, and fine collection.
Library Management Data
- Book_ID (Unique ID for books): A unique identifier assigned to each book in the library system.
- Title (Book title): The name of the book being managed in the system.
- Author (Author's name): The name of the author or authors who wrote the book.
- Genre (Book category): The classification of the book, such as Fiction, Non-fiction, Mystery, Science, etc.
- ISBN (International Standard Book Number): A unique identifier assigned to the book by publishers for global recognition.
- Publication_Year (Year of publication): The year in which the book was published.
- Publisher (Publishing house): The company or individual responsible for publishing the book.
- Copies_Available (Number of available copies): The total number of copies of the book available for borrowing in the library.
- Borrower_ID (Unique ID for borrowers): A unique identifier for each borrower who uses the library services.
- Borrower_Name (Name of the person borrowing the book): The full name of the person borrowing the book.
- Borrower_Age (Age of borrower): The age of the borrower who has checked out the book.
- Borrower_Gender (Male/Female/Other): The gender of the borrower (Male, Female, or Other).
- Membership_Type (Regular/Premium): The type of library membership, either Regular or Premium, which may offer different privileges.
- Issued_Date (Date when the book was issued): The date on which the book was borrowed by the user.
- Due_Date (Due date for return): The date when the borrowed book is expected to be returned to the library.
- Return_Date (Date of book return): The actual date when the book was returned by the borrower.
- Fine_Amount (Late return fine if applicable): The amount charged if the book is returned after the due date.
This schema should provide you with a solid foundation for the Library Management System dataset for your data analysis project.
Exploratory Data Analysis Using SQL
The library management system stores information about books, borrowers, fines, and borrowing transactions. To help library administrators make data-driven decisions, the following queries are designed to extract insights on book genres, borrower behavior, fines, and overdue books.
Let's perform some SQL queries and find quick overview as defined below:
1. Total Books by Genre
This query identifies the most popular book genres in the library based on the total number of books available in each category.
Query:
SELECT Genre, COUNT(*) AS Total_Books
FROM library_management
GROUP BY Genre
ORDER BY Total_Books DESC
LIMIT 5;
Output:
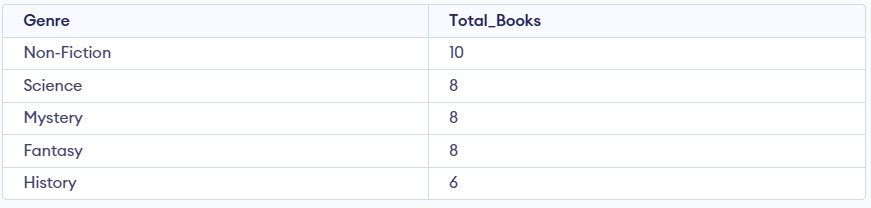
- Groups all records by Genre and counts how many books belong to each category.
- Displays the top 5 genres with the highest number of books, helping identify the most common book categories in the library.
2. Top 5 Borrowers Who Borrowed the Most Books
This query highlights the most active library users by identifying those who have borrowed the highest number of books.
Query:
SELECT Borrower_Name, COUNT(*) AS Books_Borrowed
FROM library_management
GROUP BY Borrower_Name
ORDER BY Books_Borrowed DESC
LIMIT 5;
Output:
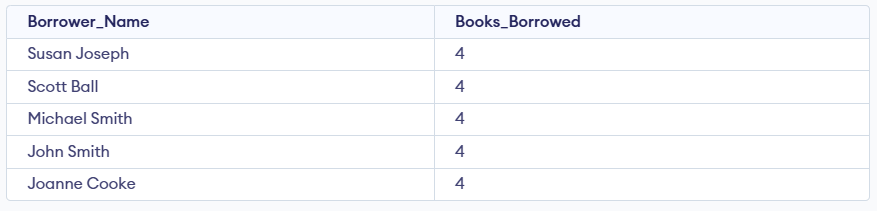
- Groups records by Borrower_Name and counts how many books each borrower has taken.
- Lists the top 5 borrowers in descending order, helping identify frequent users for engagement or rewards.
3. Total Fines Collected
This query calculates the total revenue generated from late return fines across all borrowing records.
Query:
SELECT SUM(Fine_Amount) AS Total_Fines FROM library_management;Output:

- Adds up all values in the Fine_Amount column to compute the total fines collected.
- Helps assess the impact of overdue returns and evaluate the effectiveness of fine policies.
4. Most Borrowed Books
This query identifies the most popular books in the library based on how frequently they are borrowed.
Query:
SELECT Title, COUNT(*) AS Borrow_Count
FROM library_management
GROUP BY Title
ORDER BY Borrow_Count DESC
LIMIT 5;
Output:
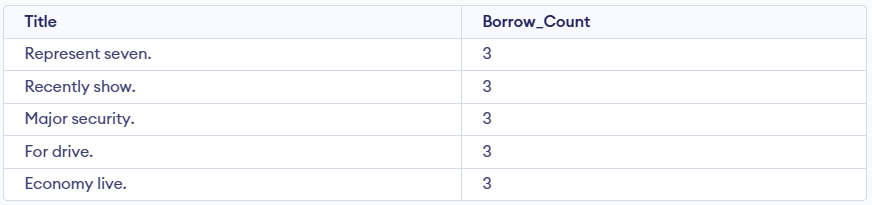
- Groups records by Title and counts how many times each book has been borrowed.
- Displays the top 5 most borrowed books, helping guide restocking and promotion decisions.
5. Books Returned Late
This query identifies books that were returned after their due date, helping analyze past overdue behavior.
Query:
SELECT Title, Borrower_Name, Due_Date, Return_Date
FROM library_management
WHERE Return_Date > Due_Date
ORDER BY Return_Date DESC
LIMIT 5;
Output:
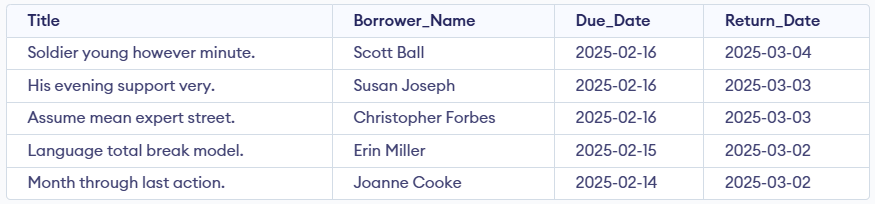
- Filters records where the Return_Date is later than the Due_Date, indicating late returns.
- Shows the 5 most recently returned overdue books, useful for fine analysis and borrower behavior tracking.
6. Currently Overdue Books
This query identifies books whose due date has passed and are still not returned.
Query:
SELECT Title, Borrower_Name, Due_Date
FROM library_management
WHERE Due_Date < CURRENT_DATE
  AND Return_Date IS NULL
ORDER BY Due_Date ASC
LIMIT 5;
Output:
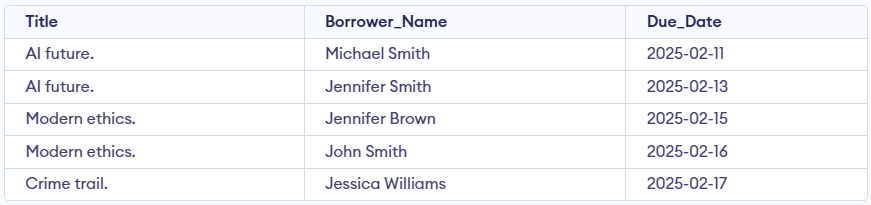
- Filters records where the due date is earlier than today and the return date is missing, indicating active overdue books.
- Lists the oldest overdue books first, helping libraries prioritize follow-ups and reminders.
Advanced-Data Analysis with Library Management Dashboard
A well-designed Power BI dashboard enables efficient visualization and analysis of library management data. This dashboard includes KPIs, bar charts, a pie chart, and slicers to derive actionable insights.
1. Key Performance Indicators (KPIs)
KPIs are essential for evaluating library performance and user engagement. The four primary KPIs in this dashboard are:
Total Books Borrowed
This KPI represents the total number of books borrowed by users. It is calculated by summing up the total borrow transactions in the dataset. Monitoring total book borrowings helps in understanding the popularity of the library and user engagement over time.
Total Active Borrowers
This KPI shows the total number of unique borrowers who have borrowed at least one book. It is determined by counting distinct user IDs in the dataset. Understanding the number of active borrowers helps the library measure its outreach and engagement with readers.
Average Fine Per Borrower
This KPI represents the average fine imposed on each borrower. It is calculated by dividing the total fine collected by the number of active borrowers. Tracking this metric helps in identifying overdue book patterns and implementing policies to minimize fines.
Books Overdue Rate
This KPI measures the percentage of books returned after their due date. It is calculated by dividing the number of overdue books by the total number of borrowed books, then multiplying by 100. Understanding the overdue rate helps libraries enforce return policies and optimize lending durations.
2. Dashboard Creation
The Power BI dashboard includes various visualizations to present data effectively:
Total Books by Genre (Bar Chart)
This visualization displays the total number of books available in each genre. The X-axis represents different genres. The Y-axis shows the count of books in each genre. Each bar represents a genre, and its height indicates the number of books available. This chart helps in:
- Identifying the most and least popular book genres in the library collection.
- Analyzing trends in user preferences to enhance the book acquisition process.
- Making informed decisions about expanding specific book categories based on demand.
Most Borrowed Books (Pie Chart)
A pie chart is used to represent the books that have been borrowed the most. Each section of the pie represents a specific book, with the size indicating the proportion of total borrowings. This visualization helps in:
- Identifying the most popular books among readers.
- Understanding book demand to manage inventory effectively.
- Determining which books should be restocked or promoted to new users.
Slicer for Interactive Analysis Due Date Slicer
Slicers allow users to interactively filter data for detailed analysis. The key slicer included is:
Due Date Slicer: This slicer enables users to filter borrow records based on due dates. Users can select a specific time range to analyze overdue trends and book return patterns. This feature helps in understanding borrowing behaviors over different periods and implementing strategies to reduce overdue books.
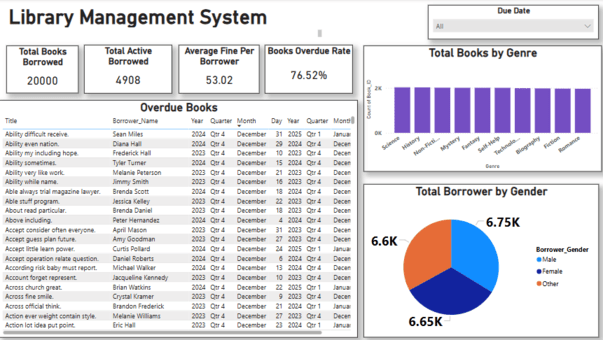
- Enables librarians to analyze borrowing trends, user engagement, and inventory performance effectively.
- Uses interactive features like slicers to explore data by due dates and time periods.
- Leverages visualizations such as bar charts and pie charts to support data-driven decisions and improve user satisfaction.
