Seaborn and Matplotlib both are commonly used libraries for data visualization in Python. We can draw various types of plots using Matplotlib like scatter, line, bar, histogram, and many more. On the other hand, Seaborn provides a variety of visualization patterns. It uses easy syntax and has easily interesting default themes. It specializes in statistics visualization.
Creating a basic plot in Matplotlib
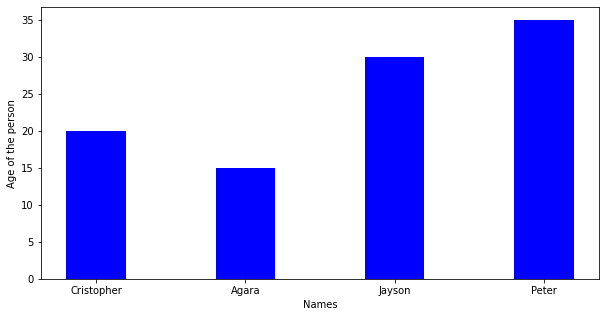
import numpy as np
import matplotlib.pyplot as plt

data = {'Cristopher': 20, 'Agara': 15, 'Jayson': 30,
        'Peter': 35}
names = list(data.keys())
age = list(data.values())

fig = plt.figure(figsize=(10, 5))

# creating the bar plot
plt.bar(names, age, color='blue', width=0.4)

plt.xlabel("Names")
plt.ylabel("Age of the person")
plt.show()
Output:
Creating basic plot in Seaborn
import seaborn as sns
import matplotlib.pyplot as plt

sns.barplot(x=["Asia", "Africa", "Antartica", "Europe"],
            y=[90, 60, 30, 10])

plt.show()
Output:

While plotting these plots one problem arises -the overlapping of x labels or y labels which causes difficulty to read what is on x-label and what is on y-label. So we solve this problem by Rotating x-axis labels or y-axis labels.
Rotating X-axis Labels in Matplotlib
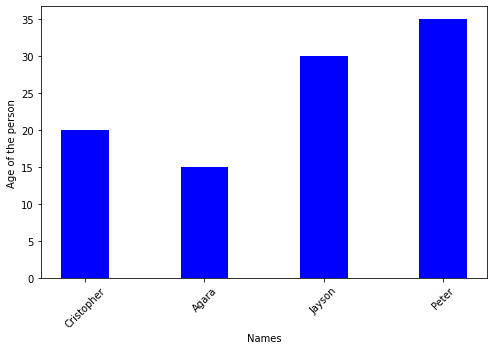
We use plt.xticks(rotation=#) where # can be any angle by which we want to rotate the x labels
import numpy as np
import matplotlib.pyplot as plt

data = {'Cristopher': 20, 'Agara': 15, 'Jayson': 30,
        'Peter': 35}
names = list(data.keys())
age = list(data.values())

fig = plt.figure(figsize=(10, 5))

# creating the bar plot
plt.bar(names, age, color='blue', width=0.4)

plt.xlabel("Names")
plt.xticks(rotation=45)
plt.ylabel("Age of the person")
plt.show()
Output:
Rotating X-axis Labels in Seaborn
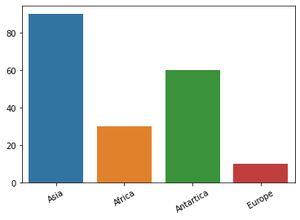
By using FacetGrid we assign barplot to variable 'g' and then we call the function set_xticklabels(labels=#list of labels on x-axis, rotation=*) where * can be any angle by which we want to rotate the x labels
import seaborn as sns
import matplotlib.pyplot as plt

g = sns.barplot(x=["Asia", "Africa", "Antartica", "Europe"],
                y=[90, 30, 60, 10])
g.set_xticklabels(
    labels=["Asia", "Africa", "Antartica", "Europe"], rotation=30)
# Show the plot
plt.show()
Output:
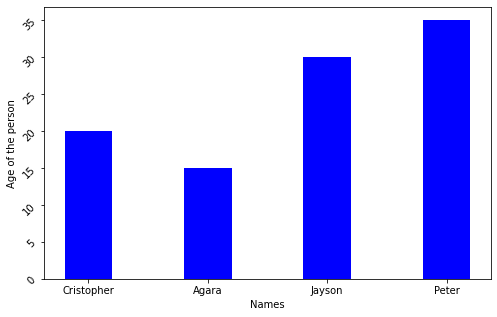
Rotating Y-axis Labels in Matplotlib
We use plt.xticks(rotation=#) where # can be any angle by which we want to rotate the y labels
import numpy as np
import matplotlib.pyplot as plt

data = {'Cristopher': 20, 'Agara': 15, 'Jayson': 30,
        'Peter': 35}
courses = list(data.keys())
values = list(data.values())

fig = plt.figure(figsize=(8, 5))

# creating the bar plot
plt.bar(courses, values, color='blue', width=0.4)
plt.yticks(rotation=45)
plt.xlabel("Names")
plt.ylabel("Age of the person")
plt.show()
Output:
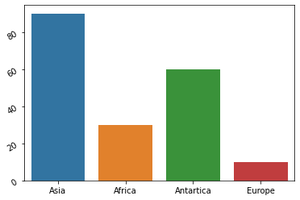
Rotating Y-axis Labels in Seaborn
By using FacetGrid we assign barplot to variable 'g' and then we call the function set_yticklabels(labels=#the scale we want for y label, rotation=*) where * can be any angle by which we want to rotate the y labels
import seaborn as sns
import matplotlib.pyplot as plt

g = sns.barplot(x=["Asia", "Africa", "Antartica", "Europe"],
                y=[90, 30, 60, 10])

g.set_yticklabels(labels=[0, 20, 40, 60, 80], rotation=30)

# Show the plot
plt.show()
Output: