

A multi-plot grid displays multiple plots in a single figure by dividing the data into different subsets. This makes it easier to compare patterns, trends, and relationships across categories without creating separate plots.
Consider a simple example where we use FacetGrid to create multiple scatter plots based on different categories.
import seaborn as sns
import matplotlib.pyplot as plt

tips = sns.load_dataset("tips")
g = sns.FacetGrid(tips, col="time")
g.map(sns.scatterplot, "total_bill", "tip")
plt.show()
Output
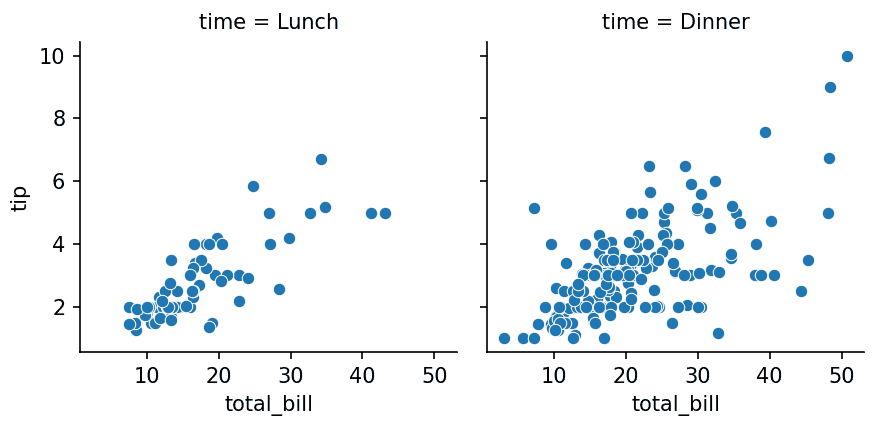
Explanation:
- Loads the built-in tips dataset.
- Creates a FacetGrid by grouping the data based on the time column.
- Draws a scatter plot for each group using total_bill and tip.
- Displays multiple plots in a single figure for easy comparison.
Syntax
seaborn.FacetGrid( data, row=None, col=None, hue=None, col_wrap=None, height=3, aspect=1, palette=None, **kwargs)
Parameters:
- data: The DataFrame containing the dataset.
- row (optional): Variable used to create separate rows of plots.
- col (optional): Variable used to create separate columns of plots.
- hue (optional): Groups data by color within each plot.
- col_wrap (optional): Wraps column facets into multiple rows after the specified number of columns.
- height (optional): Height of each subplot in inches.
- aspect (optional): Aspect ratio (width/height) of each subplot.
- palette (optional): Color palette used for the plots.
- **kwargs (optional): Additional keyword arguments passed to the FacetGrid constructor.
Multi-plot Grid Using FacetGrid
FacetGrid() creates multiple plots by dividing the dataset based on one or more categorical variables. It helps compare the same type of visualization across different groups in a single figure.
import seaborn as sns
import matplotlib.pyplot as plt

tips = sns.load_dataset("tips")
g = sns.FacetGrid(tips, col="day")
g.map(sns.scatterplot, "total_bill", "tip")
plt.show()
Output
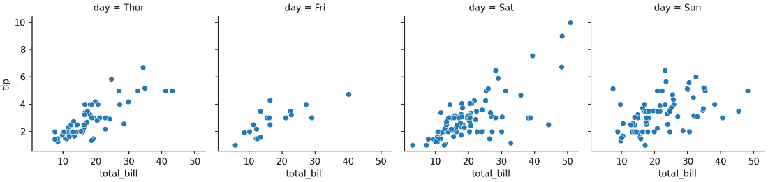
Explanation:
- Loads the tips dataset.
- Creates separate scatter plots for each day using FacetGrid.
- Plots total_bill against tip in each subplot.
- Displays all plots in a single figure for comparison.
Multi-plot Grid with Different Colors
You can use the hue parameter to display different categories with different colors inside each subplot, making comparisons easier.
import seaborn as sns
import matplotlib.pyplot as plt

tips = sns.load_dataset("tips")
g = sns.FacetGrid(tips, col="time", hue="sex")
g.map(sns.scatterplot, "total_bill", "tip")
g.add_legend()
plt.show()
Output
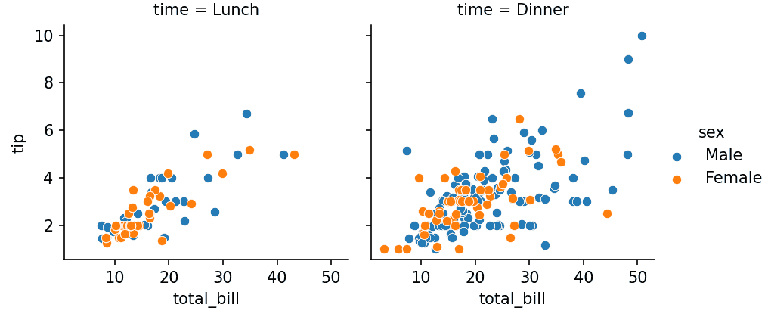
Explanation:
- Creates separate plots for Lunch and Dinner.
- Uses different colors to distinguish male and female customers.
- Adds a legend to identify each category.
- Makes category-wise comparison more clear.
Wrapping Multiple Plots into Rows
When there are many categories, you can use col_wrap to automatically arrange the plots into multiple rows for a cleaner layout.
import seaborn as sns
import matplotlib.pyplot as plt

tips = sns.load_dataset("tips")
g = sns.FacetGrid(tips, col="day", col_wrap=2, height=3)
g.map(sns.histplot, "total_bill")
plt.show()
Output
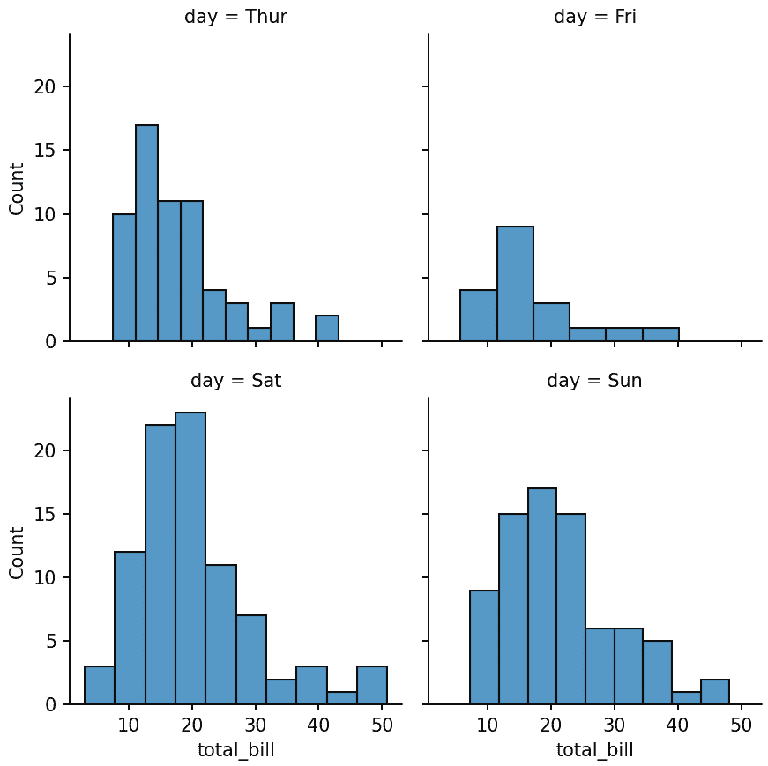
Explanation:
- Creates histograms for each day.
- Uses col_wrap=2 to display two plots per row.
- Automatically organizes the layout when there are multiple categories.
- Produces a compact and easy-to-read multi-plot grid.
