

PyQtGraph is a graphics and user interface library for Python that provides functionality commonly required in designing and science applications. Its primary goals are to provide fast, interactive graphics for displaying data (plots, video, etc.) and second is to provide tools to aid in rapid application development (for example, property trees such as used in Qt Designer).
PyQtGraph makes heavy use of the Qt GUI platform (via PyQt or PySide) for its high-performance graphics and numpy for heavy number crunching. In particular, pyqtgraph uses Qt’s GraphicsView framework which is a highly capable graphics system on its own, this brings optimized and simplified primitives to this framework to allow data visualization with minimal effort.
In order to install the PyQtGraph we use the command given below
pip install pyqtgraph
Requirements: PyQtGraph can run on any platform which supports the following packages:
1. Python 2.7 and 3+
2. PyQt 4.8+ or PySide
3. NumPy
4. python-opengl bindings are required for 3D graphics
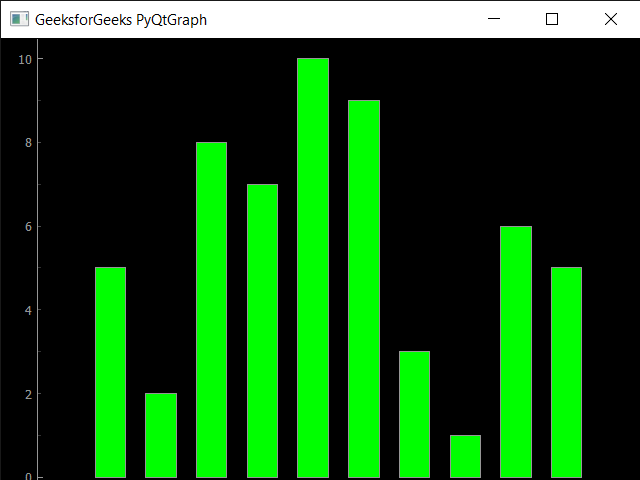
Example : In this example we will create a simple bar graph using PyQtGraph module in python
# importing pyqtgraph as pg
import pyqtgraph as pg

# importing QtCore and QtGui from the pyqtgraph module
from pyqtgraph.Qt import QtCore, QtGui

# importing numpy as np
import numpy as np

# creating a pyqtgraph plot window
window = pg.plot()

# title
title = "GeeksforGeeks PyQtGraph"

# setting window title
window.setWindowTitle(title)

# create list for y-axis
y1 = [5, 5, 7, 10, 3, 8, 9, 1, 6, 2]

# create horizontal list i.e x-axis
x = [1, 10, 4, 5, 7, 3, 6, 8, 9, 2]

# create pyqt5graph bar graph item
# with bar colors = green
bargraph1 = pg.BarGraphItem(x = x, height = y1, width = 0.6, brush ='g')

# adding bargraph item to the window
window.addItem(bargraph1)

# main method
if __name__ == '__main__':

    # importing system
    import sys

    # Start Qt event loop unless running in interactive mode or using
    if (sys.flags.interactive != 1) or not hasattr(QtCore, 'PYQT_VERSION'):
        QtGui.QApplication.instance().exec_()
Output :
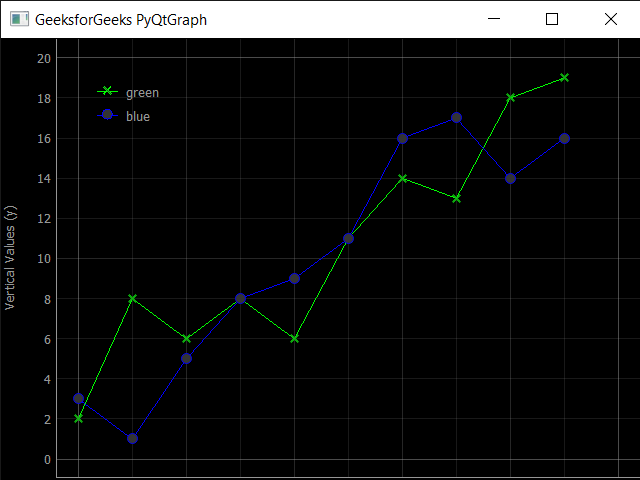
Example : In this we will plot two lines together in same graph, below is the implementation
# importing pyqtgraph as pg
import pyqtgraph as pg

# importing QtCore and QtGui from the pyqtgraph module
from pyqtgraph.Qt import QtCore, QtGui

# importing numpy as np
import numpy as np

# define the data
title = "GeeksforGeeks PyQtGraph"

# y values to plot by line 1
y = [2, 8, 6, 8, 6, 11, 14, 13, 18, 19]

# y values to plot by line 2
y2 = [3, 1, 5, 8, 9, 11, 16, 17, 14, 16]
x = range(0, 10)

# create plot object
plt = pg.plot()

# showing x and y grids
plt.showGrid(x = True, y = True)

# adding legend
plt.addLegend()

# set properties of the label for y axis
plt.setLabel('left', 'Vertical Values', units ='y')

# set properties of the label for x axis
plt.setLabel('bottom', 'Horizontal Values', units ='s')

# setting horizontal range
plt.setXRange(0, 10)

# setting vertical range
plt.setYRange(0, 20)

# setting window title
plt.setWindowTitle(title)

# plotting line in green color
line1 = plt.plot(x, y, pen ='g', symbol ='x', symbolPen ='g', symbolBrush = 0.2, name ='green')

# plotting line2 with blue color
line2 = plt.plot(x, y2, pen ='b', symbol ='o', symbolPen ='b', symbolBrush = 0.2, name ='blue')


# main method
if __name__ == '__main__':

    # importing system
    import sys

    # Start Qt event loop unless running in interactive mode or using
    if (sys.flags.interactive != 1) or not hasattr(QtCore, 'PYQT_VERSION'):
        QtGui.QApplication.instance().exec_()
Output :
Things PyQtGraph can perform :
1. Basic data visualization like images, line and scatter plots
2. Fast enough to plot realtime update of video / data
3. Interactive scaling/panning, averaging, FFTs, SVG/PNG export
4. Widgets for marking & selecting plot regions
5. Automatic slicing of multi-dimensional image data
6. Framework for building customized image region-of-interest widgets
7. Docking system that replaces/complements Qt’s dock system to allow more complex (and more predictable) docking arrangements
8. ParameterTree widget for rapid prototyping of dynamic interfaces
