

Data organisation is a process that involves structuring, categorizing, and managing data to make it more accessible, usable, and analyzable. Whether in research, business, or everyday applications, well-organized data can significantly enhance efficiency and decision-making.
The importance of data organization has grown exponentially with the increasing volume of data generated in today's digital age. By organizing data, we can ensure it is clean, accurate, and ready for analysis, leading to more informed insights and better outcomes.
Key Components of Data Organization
- Classification – Grouping data based on common characteristics or criteria.
- Categorization – Dividing data into meaningful categories for easier understanding and analysis.
- Structuring – Arranging data in an organized format such as tables, spreadsheets, or databases.
- Storage – Saving data in appropriate systems to ensure easy access and security.
- Retrieval – Making it easy to locate and use data when needed.
- Maintenance – Updating, cleaning, and managing data to keep it accurate and relevant.
Methods of Organizing Data
There are numerous methods of Organizing data, from easy and simple methods like pictographs and Tally marks to methods that can be used for complex and large data like Histograms, bar graphs, and Double bar graphs.
1) Tabular Representation
In tabular representation, data is arranged in rows and columns, making it neat and easy to understand.
| Sports | Number Of People |
|---|---|
| Cricket | 5 |
| Volleyball | 3 |
| Tennis | 4 |
| Badminton | 3 |
Presenting data in a table is clearer and easier to interpret compared to raw data, which is often difficult to remember and analyze. Such a table is called a Frequency Distribution Table, as it shows how many times (frequency) each item occurs.
2) Grouped Frequency Distribution
When a dataset is large and contains many different values, organizing each value separately becomes difficult and time-consuming. In such cases, the data is grouped into class intervals, and the number of observations in each group is counted. This method of organizing data is called a Grouped Frequency Distribution.
| Marks in group | Number of students |
|---|---|
| 30-40 | 3 |
| 40-50 | 4 |
| 50-60 | 3 |
| 60-70 | 3 |
| 70-80 | 2 |
| 80-90 | 4 |
| 90-100 | 1 |
This method makes large datasets easier to analyze.
3) Tally Marks
Tally marks are a simple way of counting and recording data.
- Each occurrence is shown by a vertical line
- The fifth count is represented by crossing four lines
- Tallies are grouped in sets of five for easy counting
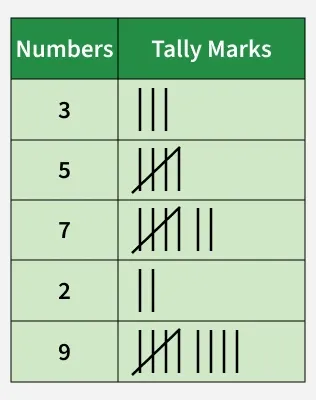
This method is commonly used for quick data collection.
4) Pictograph
A pictograph represents data using pictures or symbols. Each picture represents a fixed number of items.
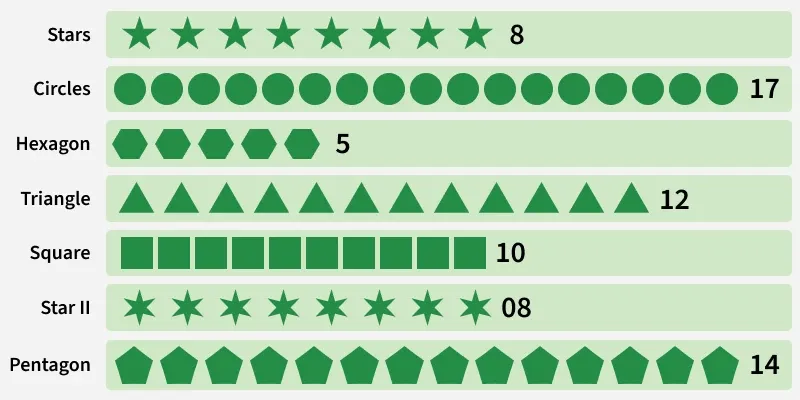
Pictographs make data visually appealing and easy to understand, especially for young learners. However, they are not suitable for large or complex datasets, as using too many pictures becomes inconvenient.
5) Bar Graph
A bar graph represents data using rectangular bars. The length of each bar corresponds to the frequency of the data.
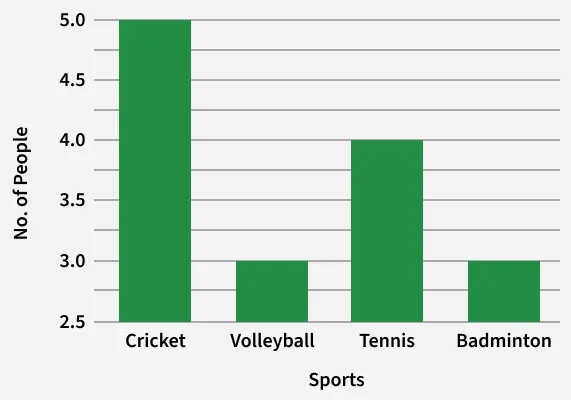
Bar graphs are widely used because they:
- Make comparison easy
- Can represent large datasets
- Clearly show differences between categories
6) Double Bar Graph
A double bar graph is used when two related sets of data need to be compared.
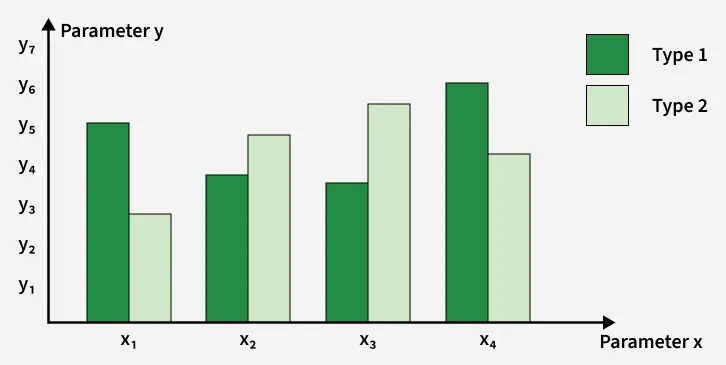
Instead of drawing two separate bar graphs, a double bar graph shows both datasets side by side, making comparison easier.
7) Pie Chart
A pie chart is a circular representation of data. The circle is divided into sectors (slices), where each slice represents a category proportional to its frequency.
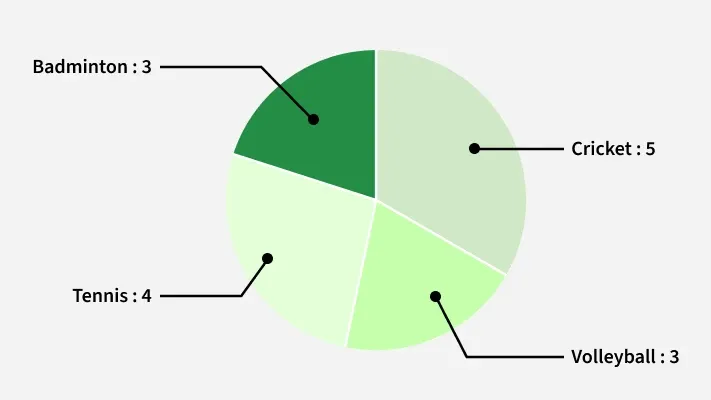
Pie charts are best used when:
- Showing relative or percentage distribution
- Comparing parts of a whole
➢Practice: Solved Examples
