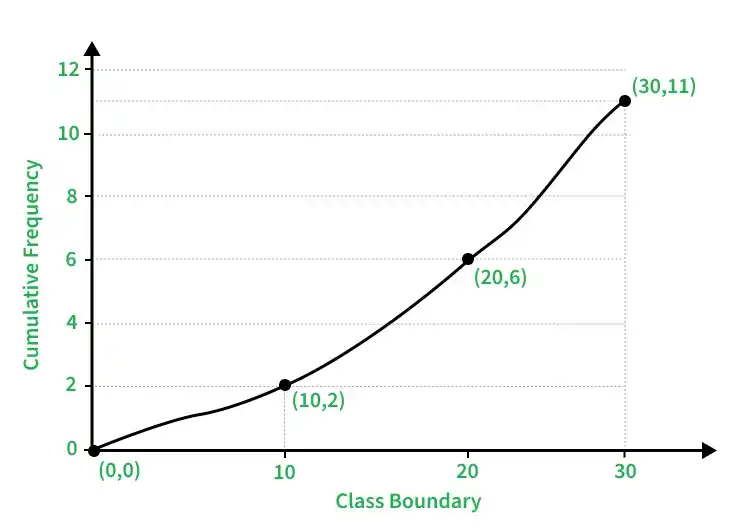
Cumulative frequency is the running total of the frequencies in a frequency distribution. It is obtained by adding the frequency of the current class to the frequencies of all preceding classes.
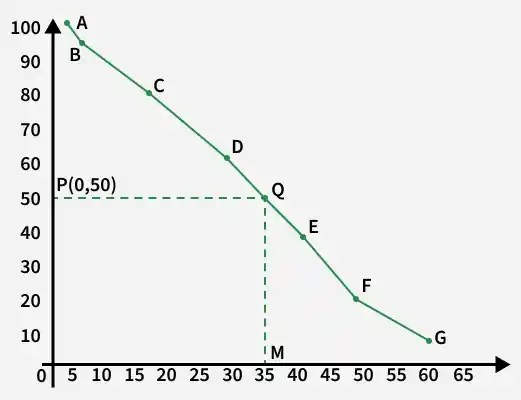
A Cumulative Frequency Curve, also called an Ogive, is the graphical representation of cumulative frequencies.
Class Interval
Frequency
Cumulative Frequency
0–10
2
2
10–20
4
2 + 4 = 6
20–30
5
2 + 4 + 5 = 11
So, the cumulative frequencies are 2, 6, and 11.
Types of Cumulative Frequency Curves
There are two types of ogives:
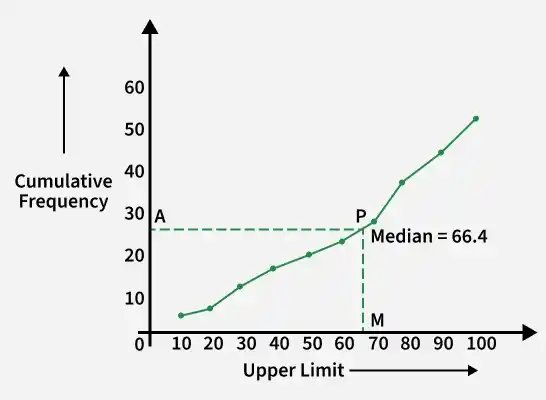
1. Less Than Ogive
In a less-than ogive, cumulative frequencies are obtained by adding the frequencies from the beginning up to the current class.
Example:
Class Interval
Frequency
Less Than CF
Upper Limit
5–10
2
2
10
10–15
4
6
15
15–20
5
11
20
Steps to Draw
Calculate less than cumulative frequencies.
Take upper class limits on the x-axis.
Take cumulative frequencies on the y-axis.
Plot the points.
Join them smoothly to obtain the Less Than Ogive.
Finding Median
Let total frequency be N.
Find N/2.
Mark N/2 on the y-axis.
Draw a horizontal line to the curve.
From the intersection point, draw a perpendicular to the x-axis.
The corresponding x-value gives the median.
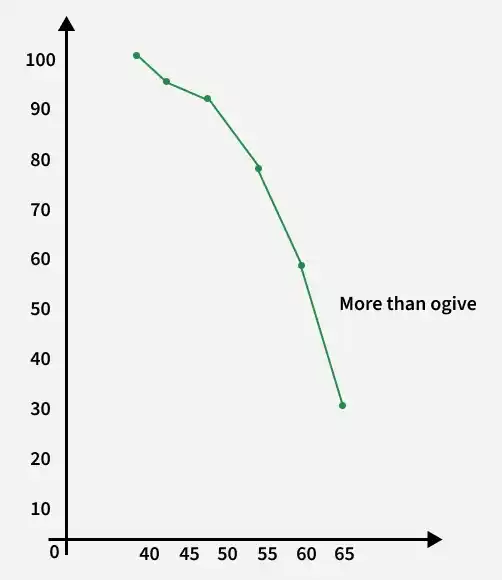
2. More Than Ogive
In a more than ogive, cumulative frequencies are obtained from the highest class downward.
Example:
Class Interval
Frequency
More Than CF
Lower Limit
5–10
20
20
5
10–15
4
16
10
15–20
5
11
15
Steps to Draw
Calculate more than cumulative frequencies.
Take lower class limits on the x-axis.
Take cumulative frequencies on the y-axis.
Plot the points.
Join them smoothly to obtain the More Than Ogive.
Finding Median
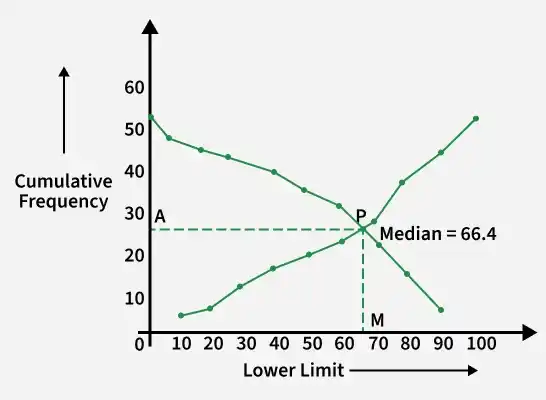
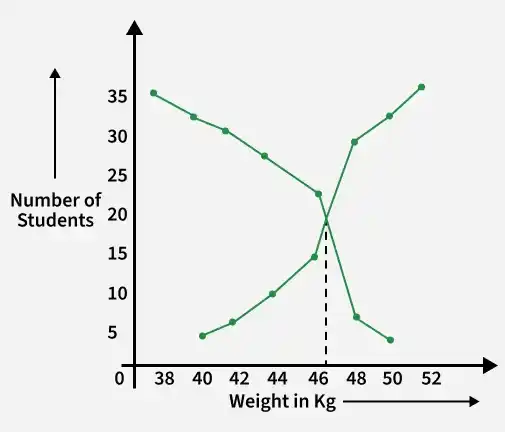
When both less-than and more-than ogives are drawn on the same graph:
Let the curves intersect at point P.
Draw a perpendicular from P to the x-axis.
The corresponding x-value gives the median.
Solved Problems
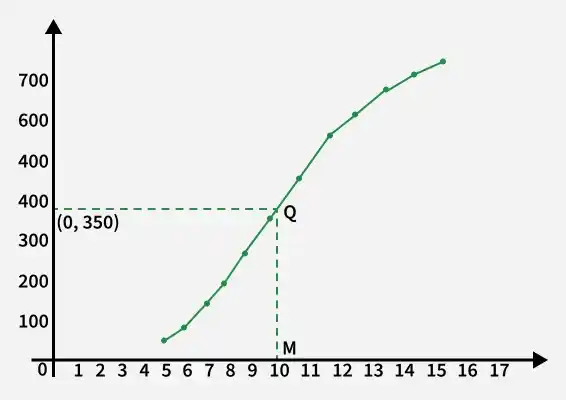
Question 1. Following is the age distribution of group students. Now, draw the cumulative frequency curve of less than type and find the median value.
Age (in years)
Frequency
4-5
36
5-6
42
6-7
52
7-8
60
8-9
68
9-10
84
10-11
96
11-12
82
12-13
66
13-14
48
14-15
50
15-16
16
Solution:
For the given table, we have to prepare the more than series as shown below:
Age (in years)
c.f.
Less than 5
36
Less than 6
78
Less than 7
130
Less than 8
190
Less than 9
258
Less than 10
342
Less than 11
438
Less than 12
520
Less than 13
586
Less than 14
634
Less than 15
684
Less than 16
700
On a graph paper, take the scale
Along the x-axis: 5 small div. = 1.
Along the y-axis: 1 small div. = 10.
And, plot all the points A(5, 36), B(6, 78), C(7, 130), D(8, 190), E(9, 258), F(10, 342), G(11, 438),