jQWidgets is a JavaScript framework for making web-based applications for PC and mobile devices. It is a very powerful and optimized framework, platform-independent, and widely supported. jqxChart is a lightweight and powerful chart widget written 100% in javascript. It offers many advanced features and supports three different rendering technologies - SVG, HTML5 Canvas & VML.
The showSerie() method is used to show a chart serie. It takes number type value and does not return any value.
Syntax:
$('Selector').jqxChart('showSerie', 'number');
Linked Files: Download https://www.jqwidgets.com/download/ from the link. In the HTML file, locate the script files in the downloaded folder:
<link rel="stylesheet" href="jqwidgets/styles/jqx.base.css" type="text/css" /> <script type="text/javascript" src="scripts/jquery-1.11.1.min.js"></script> <script type="text/javascript" src="jqwidgets/jqxcore.js"></script> <script type="text/javascript" src="jqwidgets/jqxchart.core.js"></script> <script type="text/javascript" src="jqwidgets/jqxdraw.js"></script> <script type="text/javascript" src="jqwidgets/jqxdata.js"></script>
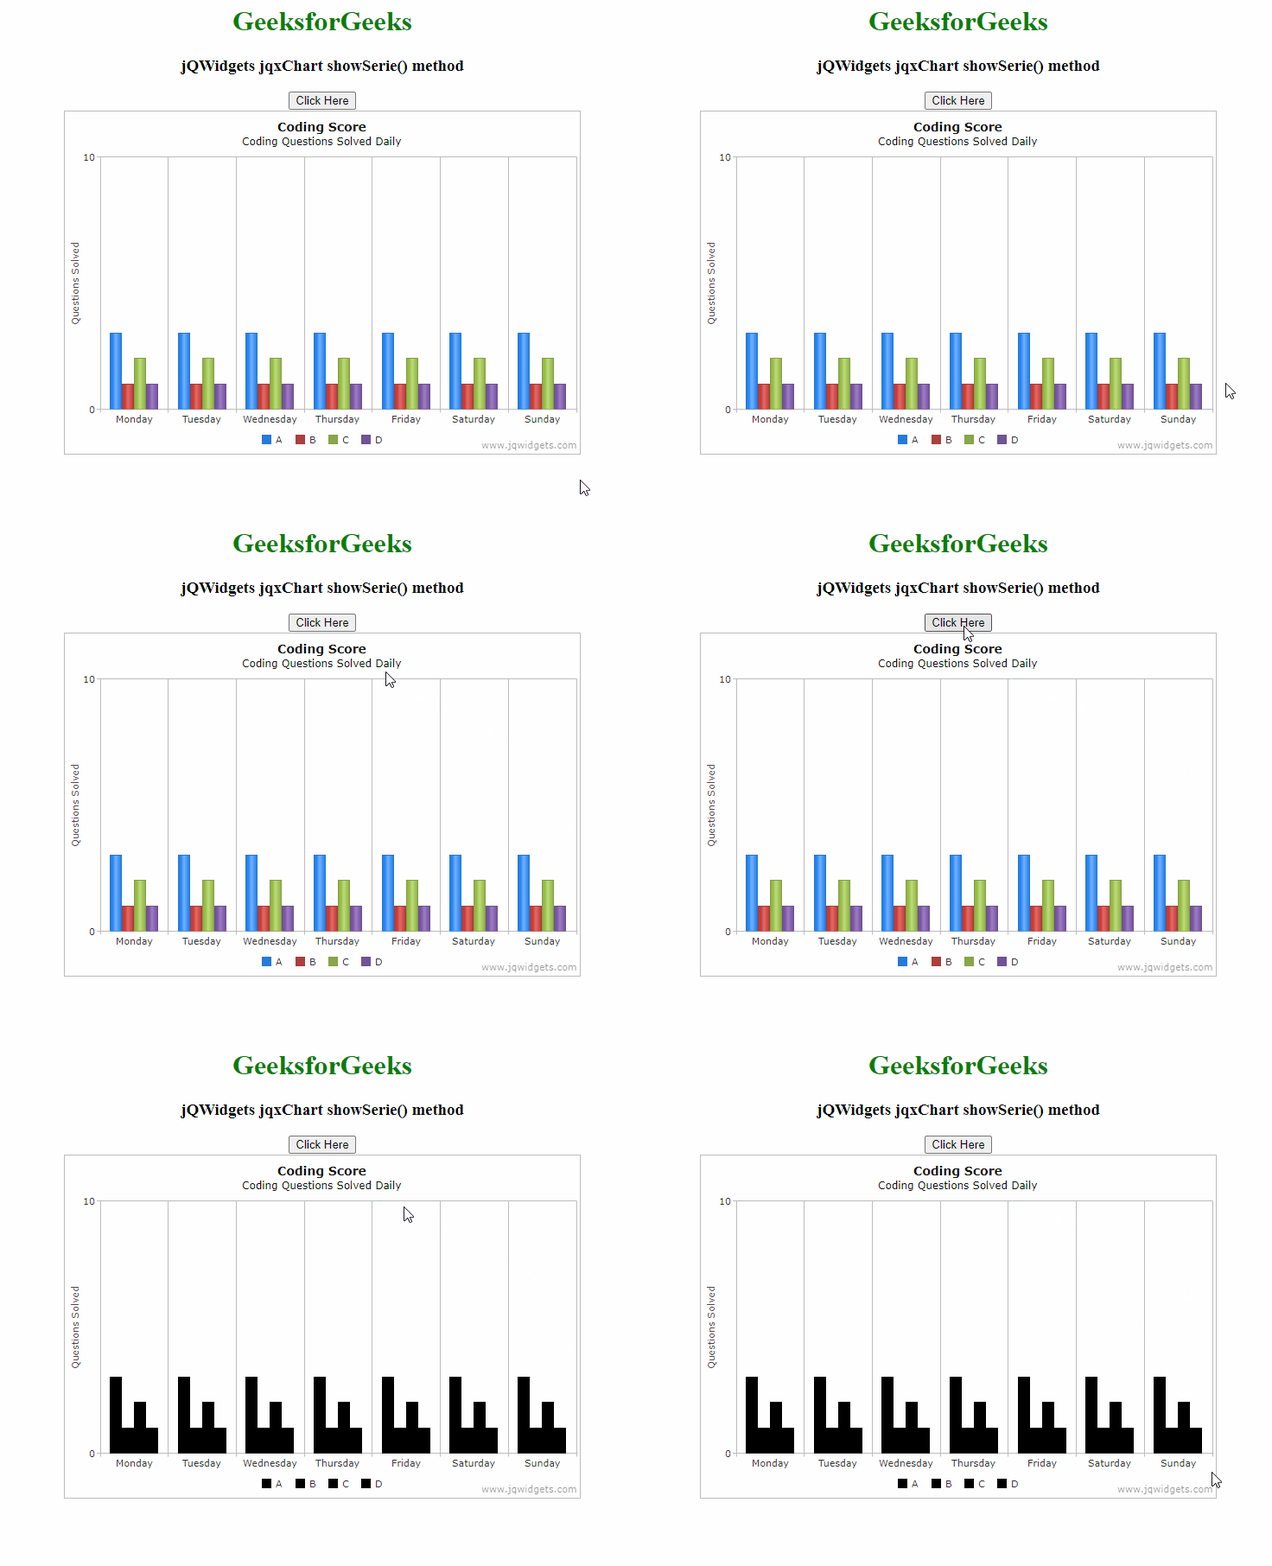
Example: The below example illustrates the jqxChart showSerie() method in jQWidgets:
<!DOCTYPE html>
<html lang="en">

<head>
    <link rel="stylesheet"
          href="jqwidgets/styles/jqx.base.css"
          type="text/css" />
    <script type="text/javascript"
            src="scripts/jquery-1.11.1.min.js">
    </script>
    <script type="text/javascript"
            src="jqwidgets/jqxcore.js">
    </script>
    <script type="text/javascript"
            src="jqwidgets/jqxchart.core.js">
    </script>
    <script type="text/javascript"
            src="jqwidgets/jqxdraw.js">
    </script>
    <script type="text/javascript"
            src="jqwidgets/jqxdata.js">
    </script>
</head>

<body>
    <center>
        <h1 style="color: green">
            GeeksforGeeks
        </h1>

        <h3>jQWidgets jqxChart showSerie() method</h3>

        <button id='gfg'>Click Here</button>

        <div id='gfg1' style="width:600px; height: 400px" />
    </center>

    <script type="text/javascript">
        $(document).ready(function () {
            var json = [
                { Day: 'Monday', A: 3, B: 1, C: 2, D: 1 },
                { Day: 'Tuesday', A: 3, B: 1, C: 2, D: 1 },
                { Day: 'Wednesday', A: 3, B: 1, C: 2, D: 1 },
                { Day: 'Thursday', A: 3, B: 1, C: 2, D: 1 },
                { Day: 'Friday', A: 3, B: 1, C: 2, D: 1 },
                { Day: 'Saturday', A: 3, B: 1, C: 2, D: 1 },
                { Day: 'Sunday', A: 3, B: 1, C: 2, D: 1 }
            ];

            var obj = {
                title: "Coding Score",
                description: "Coding Questions Solved Daily",
                source: json,
                toolTipMoveDuration: 1000,
                categoryAxis: {
                    dataField: 'Day',
                    showGridLines: true
                },
                seriesGroups: [{
                    type: 'column',
                    columnsGapPercent: 30,
                    seriesGapPercent: 0,
                    valueAxis: {
                        minValue: 0,
                        maxValue: 10,
                        unitInterval: 10,
                        description: 'Questions Solved'
                    },
                    series: [
                        { dataField: 'A', displayText: 'A' },
                        { dataField: 'B', displayText: 'B' },
                        { dataField: 'C', displayText: 'C' },
                        { dataField: 'D', displayText: 'D' }
                    ]
                }]
            };
            $('#gfg1').jqxChart(obj);

            $('#gfg').click(function () {
                $("#gfg1").jqxChart(
                    'showSerie', 0, 2, NaN);

                $('#gfg1').jqxChart(
                    'colorScheme', 'myScheme');
            });
        });
    </script>
</body>

</html>
Output: