This page is archived and may not reflect the current Faros platform.
See the platform →DORA Metrics Dashboards
Improve performance and outcomes
Measure industry-standard KPIs for software engineering velocity and quality with DORA metrics. Discover accurate, granular, and correctly attributed metrics, even in the most complex enterprise environments.













Acceleration Whiplash
The definitive data on AI's engineering impact. What's working, what's breaking, and what leaders need to do next.
- Engineering throughput is up
- Bugs, incidents, and rework are rising faster
- Two years of data from 22,000 developers across 4,000 teams
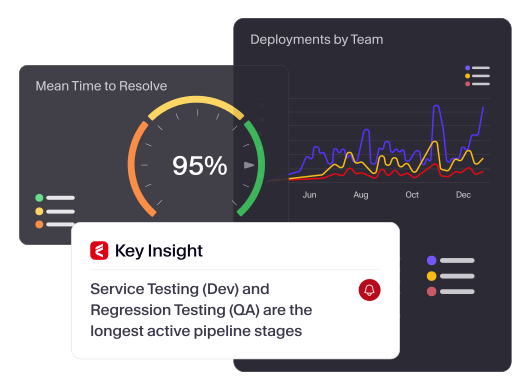
Accurate team-level DORA metrics with insights you can act upon
Feature |  | Other Vendors |
|---|---|---|
Easy | ||
Integrations to SDLC | Integrates with task, CI/CD, source control, and incident management tools—including homegrown. | Limited set of tools supported |
Ease of setup and customization | Out-of-the-box dashboards light up in minutes, and customization is easy | Time-consuming setup with no customization options |
Accurate | ||
Compatible with how teams work | Supports custom deployment processes, unique merge tools, and multiple pipelines | Standard workflows only |
Metric accuracy | Generated accurately from the complete lifecycle of every code change | Proxy metrics and loose definitions, based on Jira and VCS only |
Correct attribution | Attributed to the right team and application, even in a monorepo | Attributed to repo/project only |
Actionable | ||
Metric granularity | Detailed breakdown of all the stages within a metric (task, PR, and deployment cycles) | Typically excludes deployment cycles |
Tailored thresholds | Metrics and thresholds can be tailored to each team | One size fits all |
Personalized guidance | Team-tailored insights into performance inhibitors and recommended remediations | Not supported |
Automation and notifications | AI summaries of key insights and trends, and alerts for significant changes | AI summaries not provided |
Rollup and drilldowns | By org structure (your real teams!) or product hierarchy | Flat view by project |
Historical data | Unlimited history | Limited to 90 days for some vendors |
Enterprise Ready | ||
Security and compliance | GDPR, SOC2, and ISO 27001 compliant | Varies by vendor |
Deployment flexibility | Full SaaS, hybrid, and on-prem | SaaS only |
Remove friction from engineering workflows with DORA metrics that leaders can trust
The five DORA metrics give teams a clear view into the health of their delivery process, helping them deliver value quickly without sacrificing stability. In enterprise environments, fragmented toolchains and inconsistent definitions make DORA hard to trust and even harder to compare across teams.
Faros is field-proven to generate accurate and detailed DORA metrics dashboards in the most complex engineering organizations.
"With Faros DORA Metrics, our development teams now have the insights to pinpoint issues and prioritize improvements."

DORA metrics dashboards that explain the why
Trace every code change from idea to production
DORA metrics dashboards are the most visible measures to leadership. So we don't cut corners.
- Generate accurate metrics from task, source control, and CI/CD tools.
- Incorporate your unique deployment processes, unique merge tools, and multiple pipelines.
- See DORA software metrics within minutes with pre-built dashboards and native connectors to common version control, CI/CD, and incident management tools.
- Examine the different stages of the SDLC to identify bottlenecks and friction.
Improve DORA performance with personalized insights
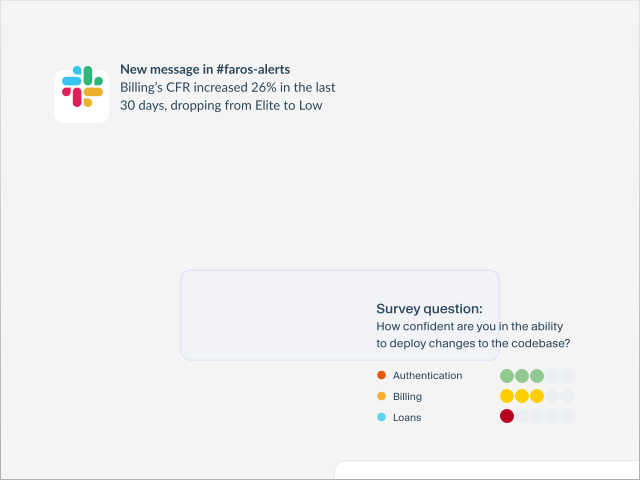
It’s hard to improve a metric you don’t understand. So we spell it out.
- Slice and dice every metric by team—based on your actual org chart—and by application.
- Overlay and correlate developer survey data with DORA metrics for additional context.
- Get alerts for meaningful changes and threshold breaches to drive improvements.
- See which activities are augmented most by AI: coding, testing,
debugging, documenting, etc.
Benchmark performance with cross-org DORA metrics scorecards
Take the pulse of the entire organization, and navigate your org structure to address hotspots.
- Get a bird's-eye view of DORA metrics, color-coded by the latest benchmarks.
- Drill down into groups and leaf teams for details and click into team dashboards for a closer look.
- Monitor trends over time to assess the true impact of interventions.
- Customize the benchmarks per team where the standard definitions don’t apply.
AI needs strong foundations
Improve DORA metrics with Faros.
See the platform in action.

Context for the work you do every day
Engineering context powers the use cases that help your organization transform as fast as AI evolves.
