Many companies are rapidly adopting cloud-native computing services, like containers, microservices, and serverless computing. Unlike monolithic applications, these technologies rely on distributed architectures.
Whether you are running them in the cloud, on-premises, or both, distributed systems consist of thousands or millions of processes and components. The challenge now is to make these complex systems’ inner workings visible, controllable, and improvable.
K8s is one of the most powerful tools for organizing, controlling, and maintaining containers, microservices, and their interdependencies.
Yet, Kubernetes is notorious for being difficult to manage using standard infrastructure monitoring tools. Here’s where Kubernetes observability comes in.
What Is Kubernetes Observability?
Observability in Kubernetes is the continuous process of using the metrics, events, logs, and trace data that a Kubernetes system generates to identify, understand, and optimize its health and performance.
Observability has its roots in Control Theory and involves collecting, visualizing, and taking action based on a system’s output data. In DevOps, observability is unique in that it provides a way to collect, analyze, and pinpoint strengths, weaknesses, and their root causes in a complex system like Kubernetes. Monitoring, on the other hand, uses predefined criteria to understand a system.
Modern Kubernetes observability increasingly relies on standardized telemetry collection through projects like OpenTelemetry (OTel), which provides a vendor-neutral framework for generating, collecting, and exporting metrics, logs, and traces from your clusters and workloads. OpenTelemetry has become the default instrumentation standard for cloud-native environments, and most of the tools discussed later in this guide either integrate with it natively or support it as a data source.
Speaking of conventional infrastructure or application monitoring vs observability, how do the two differ?
Report
Finance needs to prove AI’s return: CloudZero report
260 senior finance leaders (more than half CFOs) told us why the speed of seeing AI spend, not the size of it, separates who pulls ahead on AI from who gets burned.
What Is The Difference Between Observability And Monitoring In DevOps?
Monitoring and observability are often used interchangeably, but there are actual differences between them, including:
- Observability focuses on where, when, and why a particular event happens rather than just what is occurring and how (monitoring).
- Thus, observability plays a crucial role in root cause analysis or cause-and-effect assessment in systems and their components. Conventional application or infrastructure monitoring techniques largely highlight the current state of specific components of a system.
- Observability also emphasizes granularity, rather than totals or averages like monitoring does.
- Moreover, observability involves studying variables, patterns, and changes as they emerge in a system, whereas monitoring typically involves gathering predefined telemetry data (metrics, logs, events, and traces).
- Besides, monitoring helps collect and analyze data that’s already known to relate to application, infrastructure, or network performance issues. In contrast, observability provides you with the context you need to detect, understand, and respond to issues you may not yet be aware of.
- Monitoring involves continually tracking and reporting the state of a system at a specific time. But observability involves using multiple streams of intelligence, including monitoring data, to discern the overall health and performance level of a system.
- While monitoring is reactive, observability is about continuous improvement or prevention.
- Also, monitoring involves more specific tasks, such as monitoring application performance, network performance, and security. Observability takes a context-based approach, in which teams analyze multiple factors to infer a system’s health.
However, observability and monitoring are closely linked because they reinforce each other.
Why Is Kubernetes Observability So Important?
As you might have already noticed, observability can be quite some work. But observability has equally massive benefits. Observability has even more importance in Kubernetes, given how complex the average enterprise’s K8s deployment is.
Here are seven of the most powerful benefits of K8s observability that become apparent almost immediately and over time.
- Improves Kubernetes visibility: Observability tools and techniques enable you to achieve deeper and clearer visibility into your Kubernetes system based on inputs and outputs.
- Observability minimizes complexity: It brings together health and performance data from multiple components, giving you a clear picture of your distributed Kubernetes system.
- Improves understanding: It also correlates telemetry data to provide a context that then helps you identify issues or opportunities and how they relate to each other.
- Helps prevent problems before they occur: By proactively interpreting observability data, you can detect potential issues before they escalate into problems that affect your Service Level Agreements (SLAs) or customer experiences.
- Provides actionable intelligence: Kubernetes observability solutions and techniques break down health and performance data into granular insights to improve root cause analysis.
- Helps reduce downtime: By enabling you to identify the root cause of a system issue, observability also helps minimize time to discover, fix, and restore operations back to normal.
- Minimizes unwanted surprises: Because observability also measures and presents “unknown unknowns”, it also helps bring attention to unexpected changes in a Kubernetes environment.
- Facilitates continuous improvement: You can swiftly adopt new lessons learned and apply them to subsequent deployments, such as predicting what issues you might encounter when updating Kubernetes, an add-on, or an application.
By understanding what is happening and why, Kubernetes observability helps you better visualize, manage, and optimize the unpredictable, distributed, and open-source nature of Kubernetes deployments.
Kubernetes Observability Challenges: What Can You Expect?
Kubernetes systems typically have many interconnected components, meaning they have more potential failure points. That also increases the number of areas you need to monitor.
Pods are ephemeral by design — they spin up, crash, restart, and get rescheduled across nodes constantly. By the time an engineer investigates an issue, the pod that triggered it may no longer exist, taking its local logs and state with it. This ephemerality makes traditional log-based debugging unreliable without a centralized collection layer.
Also, because these components are interdependent, you need to observe them simultaneously to understand their relationships. For instance, any change to a single codebase or system component affects your whole app and its dependencies.
Scale amplifies the problem. In a production cluster running hundreds of pods across dozens of nodes, the volume of metrics, logs, and traces is enormous. Without structured collection and intelligent filtering, the sheer noise makes it difficult to separate meaningful signals from routine chatter.
Containers and microservices are highly dynamic, highly scalable, and generate massive volumes of health and performance data. So, applying observability to them in real time is challenging, especially without using robust Kubernetes observability tools.
Many Kubernetes monitoring tools only collect data at the app and infrastructure levels. They also struggle to correlate, enrich, and contextualize data from hybrid cloud, multi-cloud, or multi-tenant architecture environments, making them less effective. Technologies like eBPF (Extended Berkeley Packet Filter) are helping close this gap by enabling deep kernel-level visibility with minimal overhead, capturing network flows, system calls, and application behavior without modifying application code or adding heavy sidecars.
Yet, not all tools are created equal.Here are nine K8s observability solutions to help you better understand your Kubernetes environment.
9 Kubernetes Observability Tools Available Now
While some of the following tools provide full-stack observability for Kubernetes, others deliver specific capabilities, like Kubernetes cost observability.
1. CloudZero — Granular Kubernetes Cost Observability
CloudZero is unique in that it is designed as a cost observability platform rather than a mere cost monitoring and optimization tool for Kubernetes. CloudZero captures, enriches, and presents Kubernetes cost data from both your infrastructure and application without requiring cost allocation tags.
CloudZero delivers contextual cost data that includes costs from tagged, untagged, and untaggable resources to give you a complete picture of your Kubernetes costs.
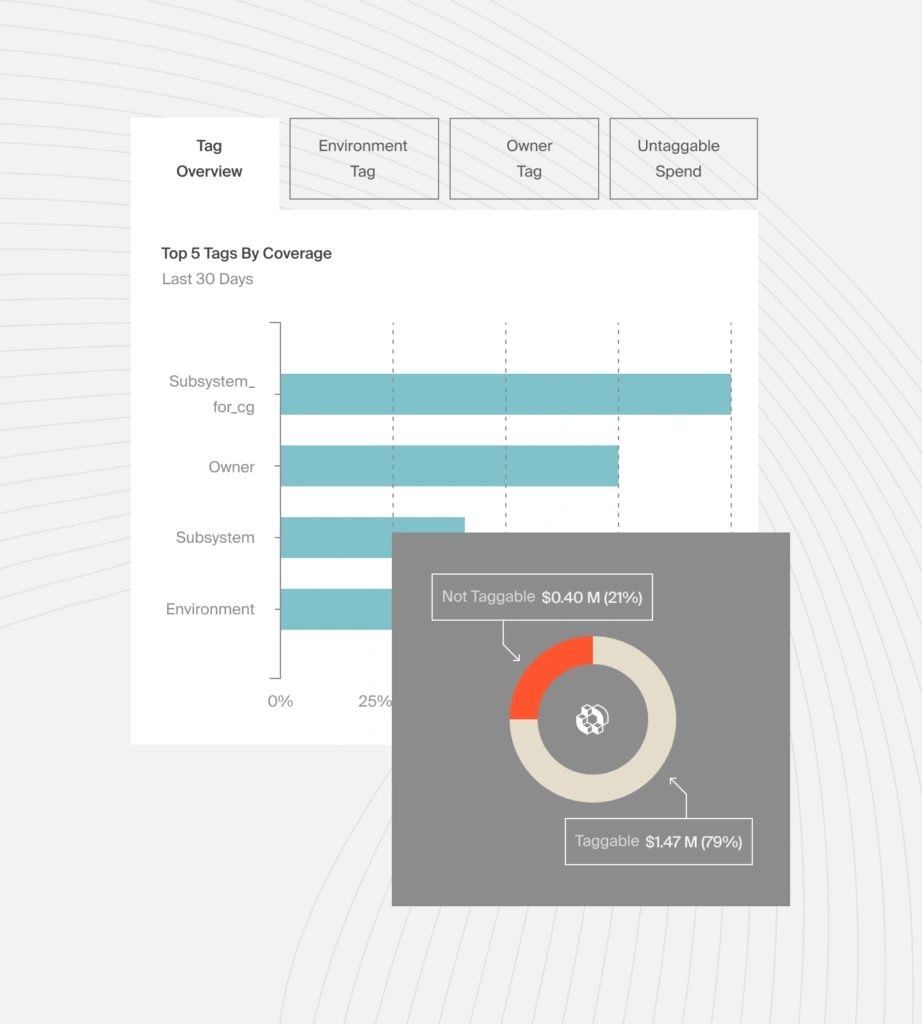
Even better, CloudZero’s Kubernetes cost analysis lets you zoom into your cost data to view, understand, and share cost intelligence by K8s concepts, like:
- Cost per namespace
- Cost per pod
- Cost per cluster
- Cost per hour
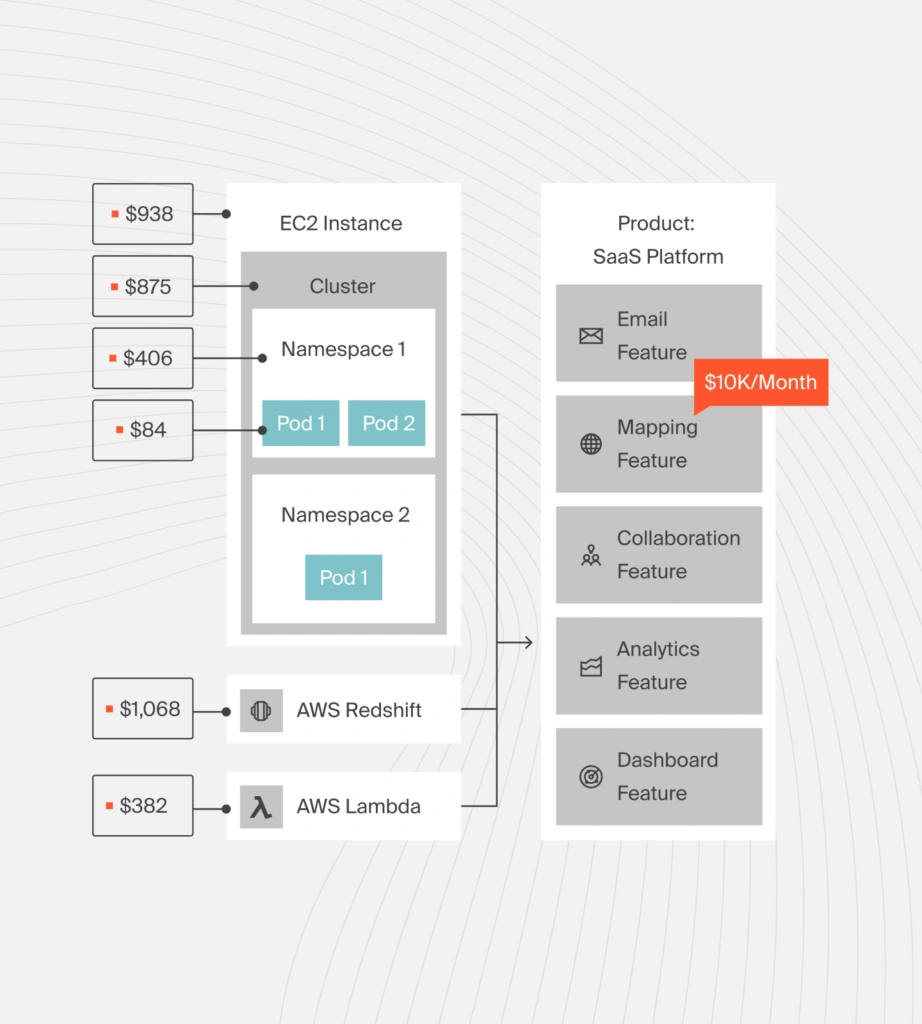
In addition, you can view, understand, and take action on specific cost areas of your business, like:
- Cost per Kubernetes environment
- Cost per service
- Cost per deployment
- Cost per customer
- Cost per product
- Cost per product feature
- Cost per team, and more
CloudZero also enables you to compare Kubernetes costs with other cloud and software spend. You can combine K8s costs with AWS, Azure, GCP, Snowflake, and other costs within a single platform for easier analysis.
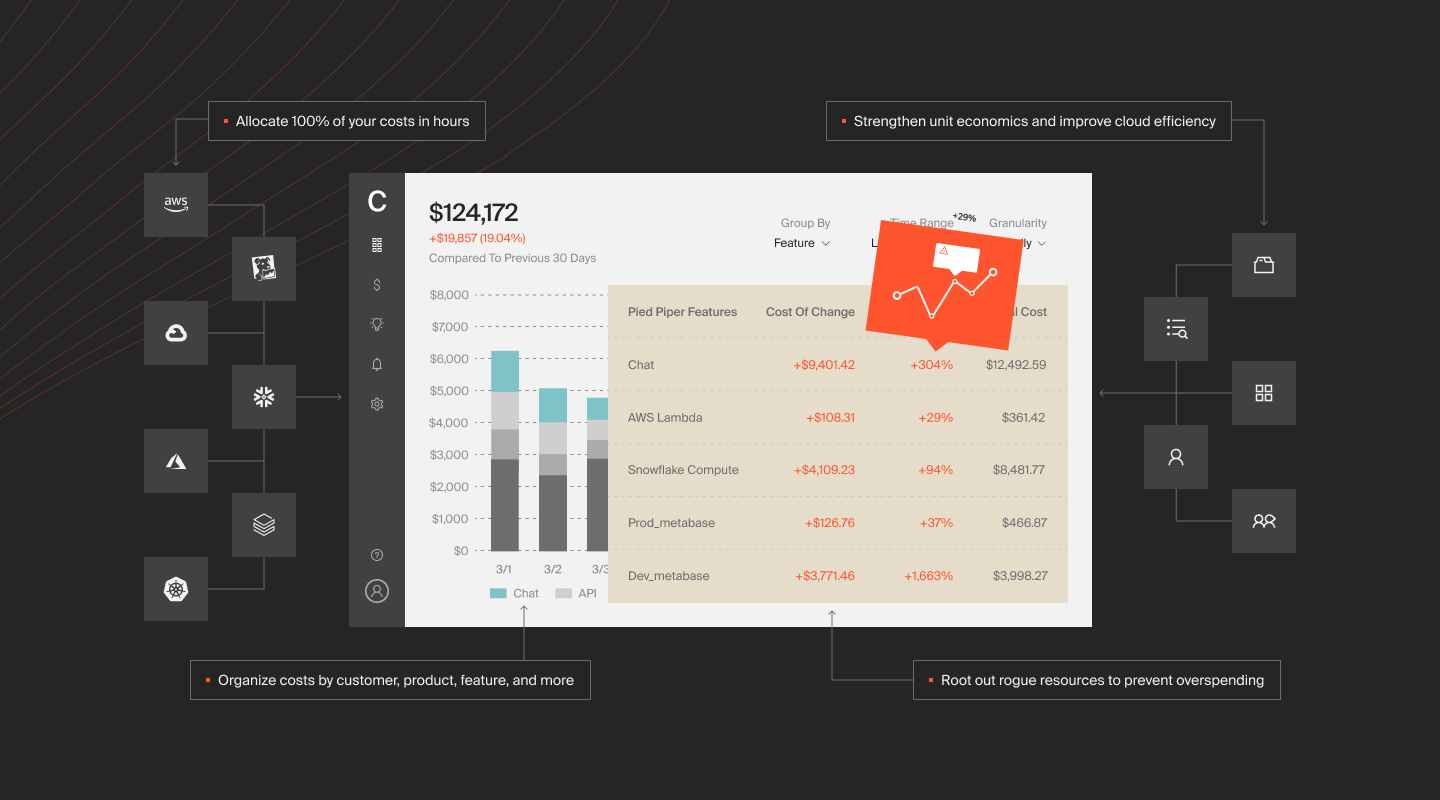
You also get real-time cost anomaly detection, intelligent alerting to reduce alert noise, and a highly visual platform to streamline analysis.  to see CloudZero’s Kubernetes cost analysis approach in action.
2. Prometheus — Open-Source Observability for Kubernetes
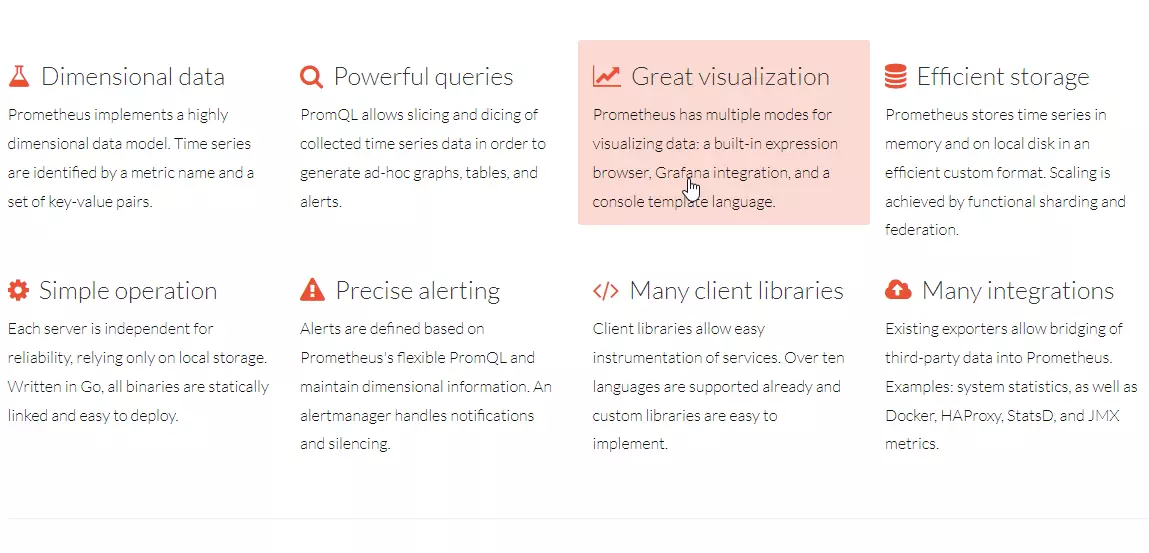
If you are looking for an open-source, full-stack observability tool with alerting capabilities, Prometheus can help.
Prometheus gathers metrics from your K8s containers, pods, nodes, services, and user applications. Like Kubernetes, it is cloud-native and uses time-series metrics collection, built-in query language, and third-party exporters to capture and help make sense of your data.
You can also run it stand-alone, with a Kubernetes Operator, or in combination with a visualization tool like Grafana. Prometheus is also the backend that powers many managed Kubernetes monitoring services, and it integrates natively with OpenTelemetry for metrics collection.
3. Grafana – Kubernetes observability dashboards and alerts
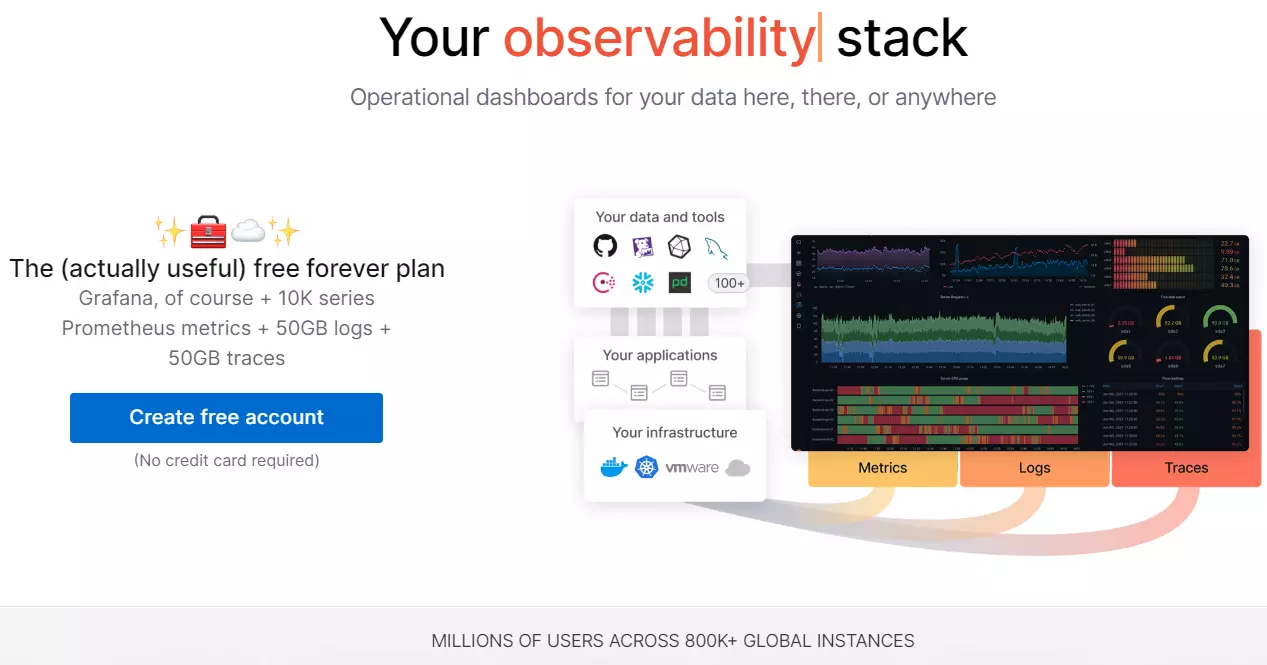
Available in enterprise and open-source versions, Grafana is an ultra-popular data visualization and analytics tool that works with both Kubernetes and Prometheus.
The paid Enterprise version offers authentication, premium support, and integrates with many commercial monitoring platforms, like AppDynamics (APM) and Datadog (full-stack monitoring).
The free, open-source version delivers a highly visual tool for exposing Kubernetes observability data (metrics, logs, and traces).
4. The ELK Stack – Open-source K8s observability stack

The ELK suite includes three open-source solutions: Elasticsearch, Logstash, and Kibana. Elasticsearch serves as a search and analytics engine.
Logstash provides a server-side (ingest) data pipeline. Logstash pulls data from multiple sources concurrently, transforms it, and then pushes it to a repository like Elasticsearch for analysis at the scale of your Kubernetes deployment.
Kibana visualizes observability data with graphs and charts. Beats, another component, eases shipping log data.
5. Splunk – Full-stack Kubernetes Observability
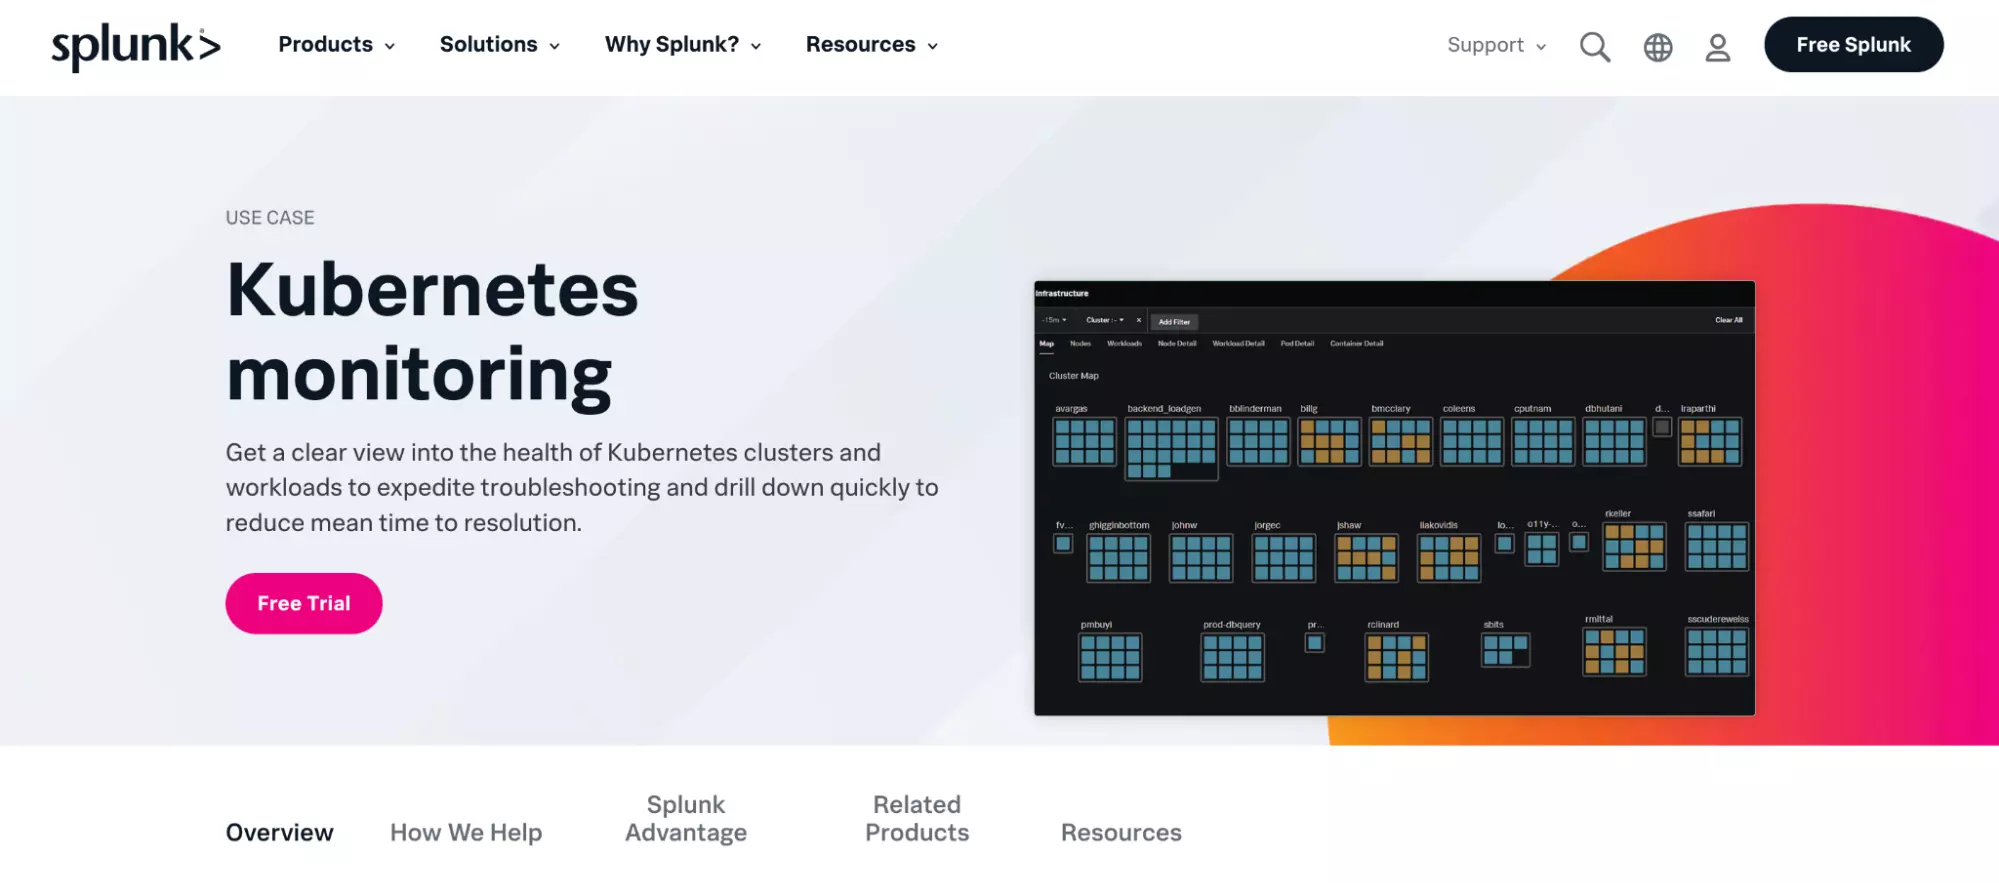
Now part of Cisco following its $28 billion acquisition, Splunk Observability Cloud gives you a quick, detailed, and hierarchical analysis of your K8s nodes, pods, and containers. Splunk scrapes your infrastructure and apps, gathers your K8s logs, and uses artificial intelligence to provide context to the health and performance of your Kubernetes clusters. Recent updates include expanded OpenTelemetry support and AI infrastructure observability capabilities.
6. IBM Instana — Full-Stack K8s Observability Platform
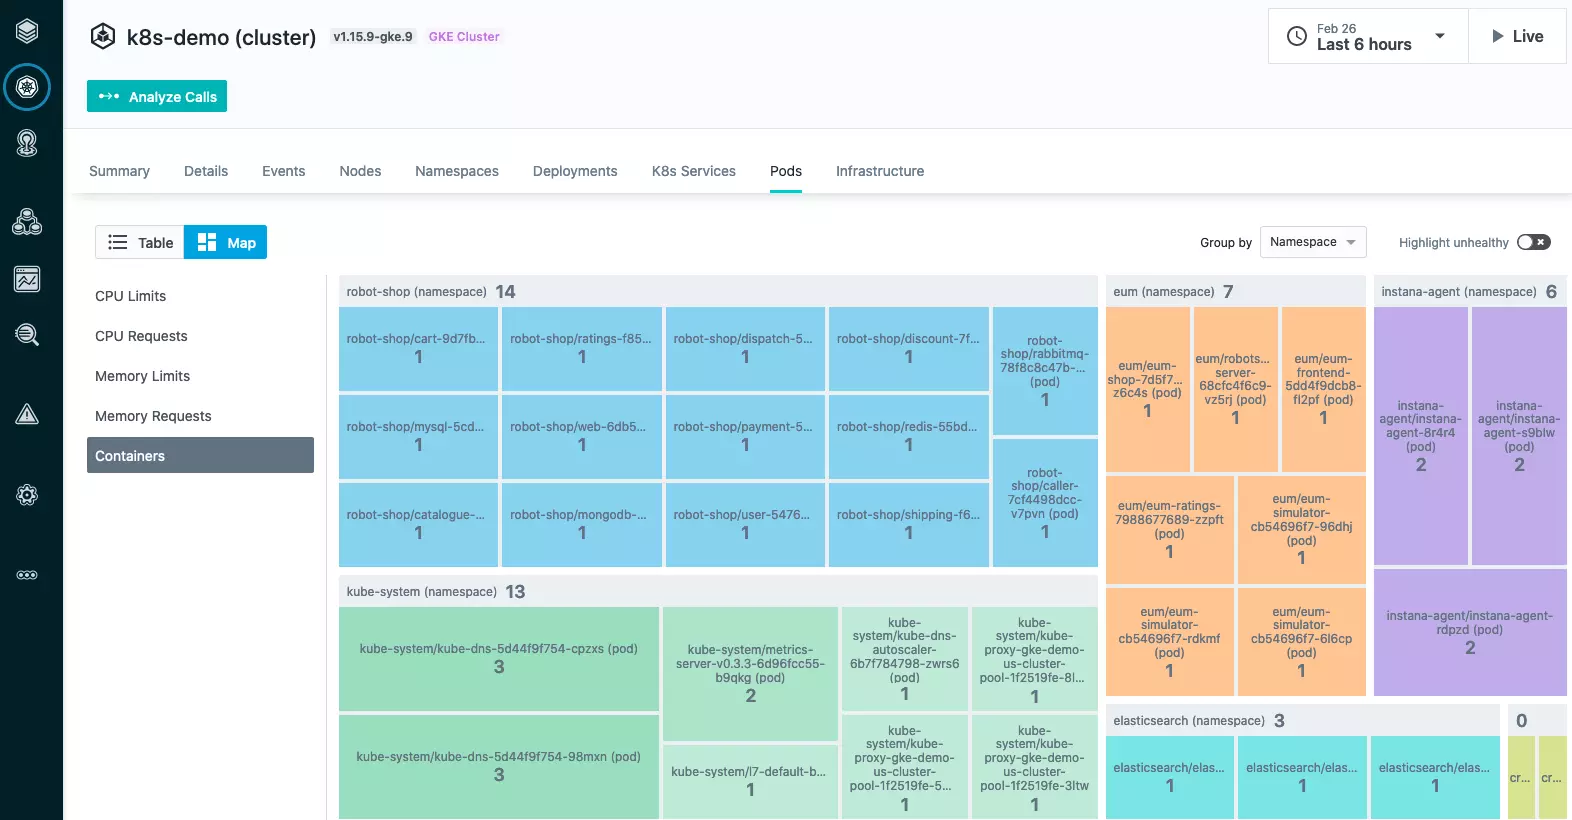
IBM Instana’s K8s observability tool captures health and performance insights from your containers, nodes, apps, and pods. It also supports all K8s distributions, including Red Hat’s OpenShift, Amazon Elastic Kubernetes Service (EKS), and Rancher. It automatically discovers your K8s services and enables real-time correlation and updates.
7. Sematext – Agent-based Kubernetes observability
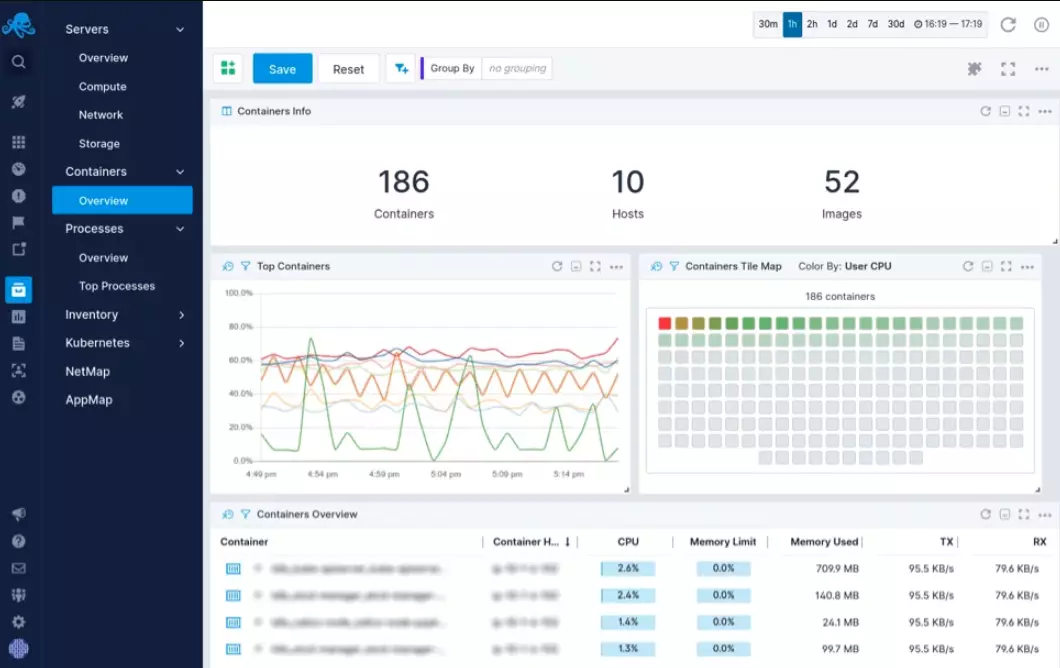
Sematext runs as a DaemonSet on K8s to capture, transform, and make sense of your Kubernetes environment. It uses container and host logs, metrics, and events for that. It derives the data from multiple sources, including infrastructure, apps, nodes, pods, services, and third-party integrations.
8. Pixie – eBPF-based K8s observability solution
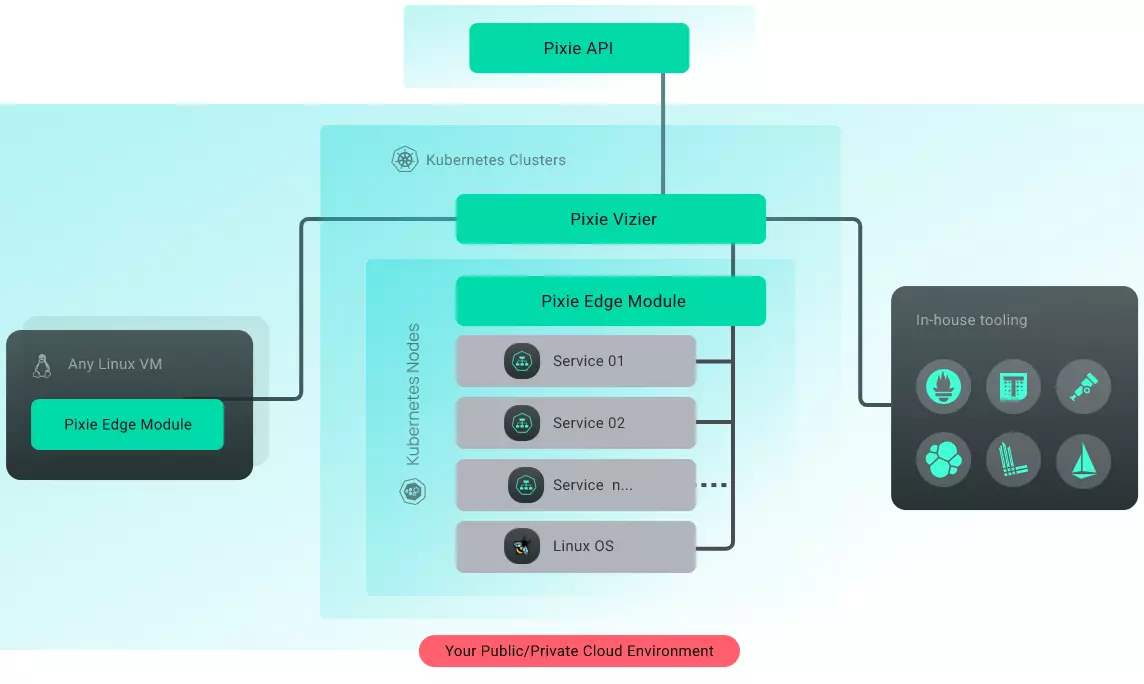
Pixie, now a CNCF Sandbox project integrated with New Relic, delivers a lightweight tool for observing Kubernetes metrics, events, traces, and logs. It uses eBPF ingestors and probes to collect telemetry directly from the Linux kernel without requiring application-level instrumentation. Pixie also runs entirely in Kubernetes, minimizing the complexity and bottlenecks of third-party integrations. Also, it enables you to use custom scripts to debug your K8s bugs as code.
9. New Relic integration with Pixie for Kubernetes observability
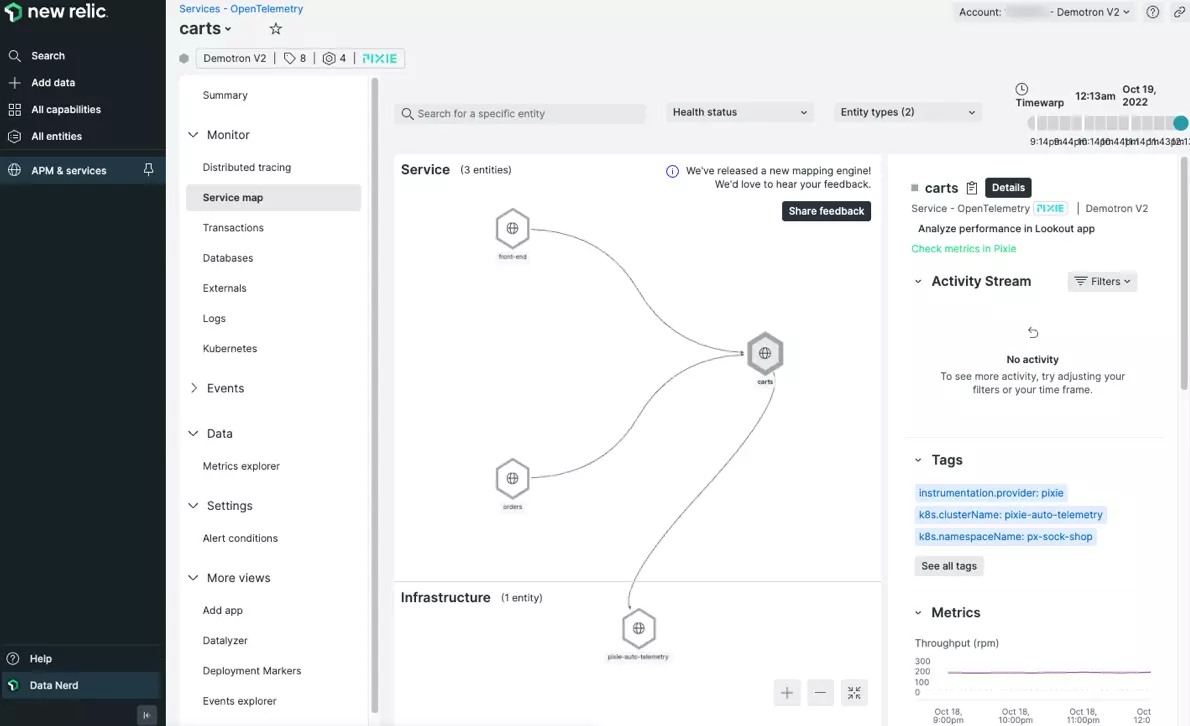
With this combo, New Relic’s full-stack Kubernetes monitoring service works in tandem with Pixie’s eBPF-based observability approach.
New Relic adds premium support, long-term Pixie telemetry retention, incident correlation, and smart alerting. Pixie contributes advanced capabilities like increasing visibility into unsampled requests and service-level metrics.
Kubernetes Observability Best Practices and Monitoring Tips
Applying observability well in Kubernetes takes more than deploying a tool and hoping for the best. Here are practical best practices that reflect how teams actually run K8s observability in production.
- Keep track of all key Kubernetes components, including pods, nodes, clusters, deployments, and services. Use metrics-server for resource metrics and kube-state-metrics for object-level state data across your cluster.
- Always use metrics, logs, and event traces together — they are the three pillars of observability. When one pillar is missing, root cause analysis becomes guesswork.
- Standardize on OpenTelemetry for instrumentation where possible. OTel provides a vendor-neutral collection layer that prevents lock-in and simplifies switching between backends as your needs evolve.
- Automate Kubernetes observability with a robust tool so you can collect accurate, real-time, and actionable insights without manual overhead.
- Log application data outside the cluster. Some K8s observability agents run inside the cluster they monitor. If a cluster fails, the monitoring agent fails with it. Unless your system has failover capability, centralize your telemetry data in an external store.
- Avoid relying solely on managed Kubernetes services such as GKE, AKS, and EKS for all your observability work. You might not get the insights that matter most to your particular business from them.
- Treat cost as an observability signal. Understanding what is happening in your cluster means little if you cannot connect performance data to spending patterns. Kubernetes cost observability — tracking spend by namespace, pod, service, or team — closes the loop between engineering decisions and their financial impact.
- Getting a true picture of your Kubernetes deployment’s health and performance requires relating your findings to what else is going on. Context is key.
- Use observability proactively to identify, understand, and resolve potential problems before they escalate into costly issues.
Achieve Better Kubernetes Cost Observability With CloudZero
Most conventional cost tools only show total and average Kubernetes costs, without highlighting who, what, and why your Kubernetes spend is changing.
With CloudZero, you can zoom in and out of K8s cost data to get a clear picture of how much you’re spending on specific services, pods, clusters, customers, deployments, and more. CloudZero’s observability approach also lets you collect unknown unknowns like costs of untagged, untaggable, and multi-tenant resources — automatically.
But don’t just take our word for it. .