Datadog and New Relic didn’t become some of the best observability platforms today by accident. Unlike traditional monitoring tools, both are built from the ground up to be cloud-native.
This design is crucial for tracking system health across hybrid cloud infrastructure, modern applications, and microservices/containerized architectures. Both platforms also offer more flexible pricing models than the traditional subscription-based pricing you’ll see elsewhere.
Yet, the two differ in several key areas. Where? This Datadog vs. New Relic comparison covers pricing, performance, integrations, AI capabilities, and more to guide your decision.
What Does Datadog Do?
Datadog is an enterprise-grade, cloud-based monitoring and observability platform. It is designed for real-time performance, security, and insights tracking across your entire tech stack — including applications, servers, databases, and cloud services.
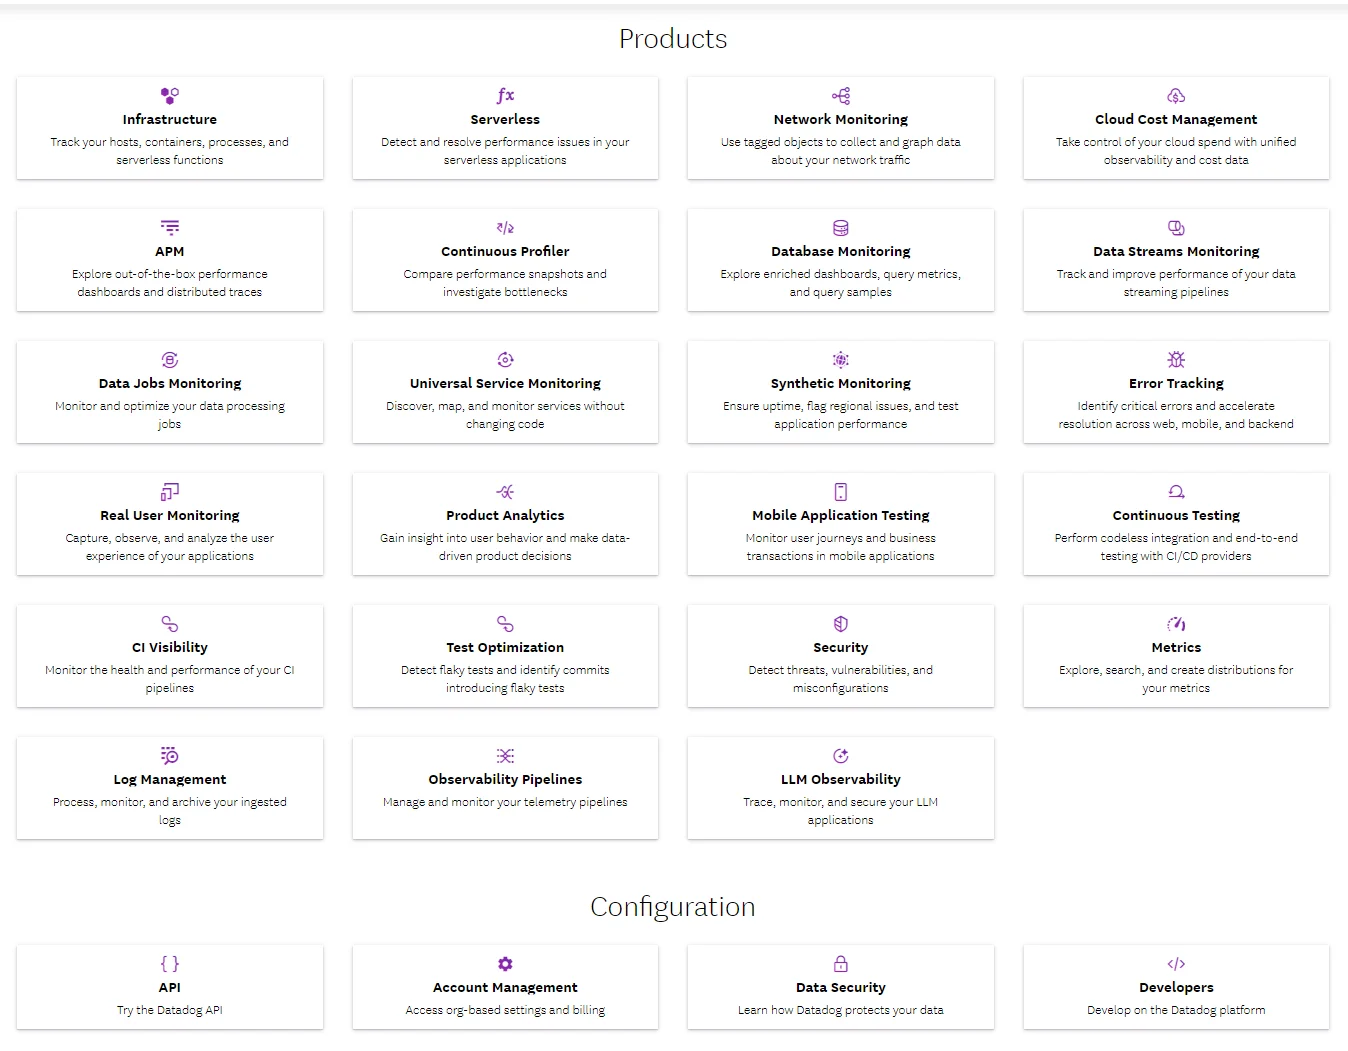
Image: Datadog products and services
Key capabilities include infrastructure monitoring, application performance monitoring (APM), log management, and customizable dashboards. With over 1,000 integrations, the Datadog Agent helps you collect logs and metrics for deep analysis.
Additionally, custom dashboards allow you to focus on the metrics that matter most, streamlining data analysis.
Yet, Datadog does have some drawbacks. A common complaint is its complex and unpredictable pricing structure. Log ingestion and retention costs, which are volume-based, can also be a pain point.
Report
Finance needs to prove AI’s return: CloudZero report
260 senior finance leaders (more than half CFOs) told us why the speed of seeing AI spend, not the size of it, separates who pulls ahead on AI from who gets burned.
What Does New Relic Do?
New Relic was the first to offer Application Performance Monitoring (APM) as a service (SaaS) and is two years older than Datadog. Like Datadog, it was built cloud-native from the start.
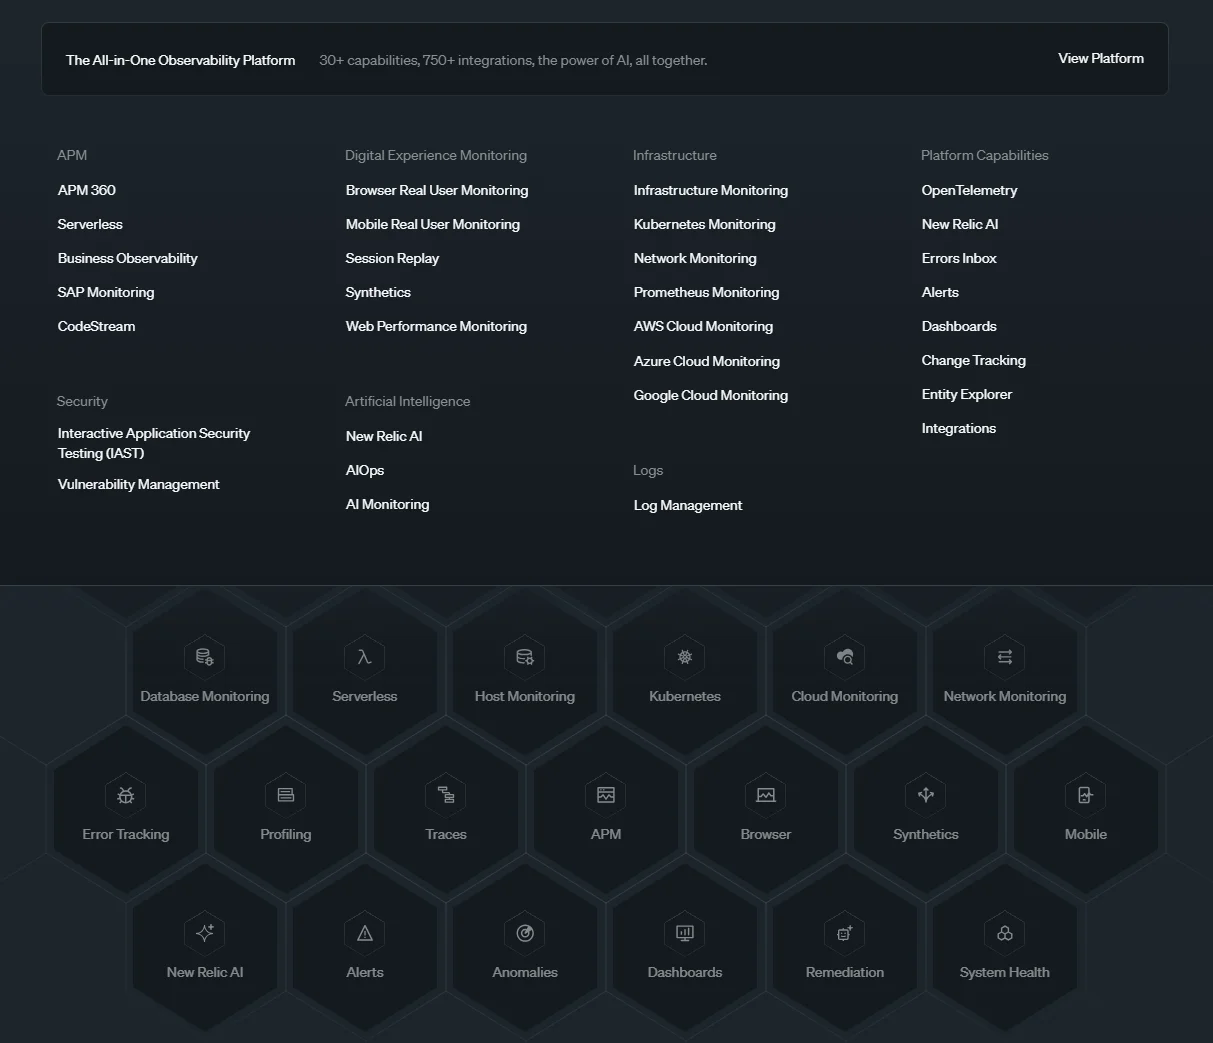
Image: New Relic products and services
New Relic combines APM, infrastructure monitoring, log management, and synthetic monitoring into a unified solution. This integration helps teams break down data silos, streamline operations, and identify issues before they impact customers.
One standout feature is its AI-powered analytics, which automatically detects anomalies and provides actionable insights. And this can help your team minimize alert fatigue and boost operational efficiency.
With support for over 800 integrations, New Relic makes it easy to ingest and analyze data from various sources across your tech stack. New Relic has also overhauled its pricing model in recent years to improve clarity and transparency, now offering both per-user and compute-based billing options.
Still, it also has its limitations, which we’ll explore further in comparison to Datadog.
Datadog Vs. New Relic: Core Differences
Here’s a detailed comparison of New Relic and Datadog across seven essential dimensions:
1. User interface and data visualization
Datadog’s relevant graphics and custom dashboards help minimize overwhelm, considering all the insights you need to monitor.
Its dashboards integrate metrics, logs, and traces into a single view, allowing you to create responsive, grid-based layouts that adapt to any screen size, which is excellent for advanced data point comparisons.
Synchronized dashboards also help you track incidents across different metrics using a common tagging structure — great for improving correlation between data sources.
New Relic has revamped its interface to improve simplicity without sacrificing depth of insight. This means you can easily access key performance indicators (KPIs) and service level objectives (SLOs) at a glance.
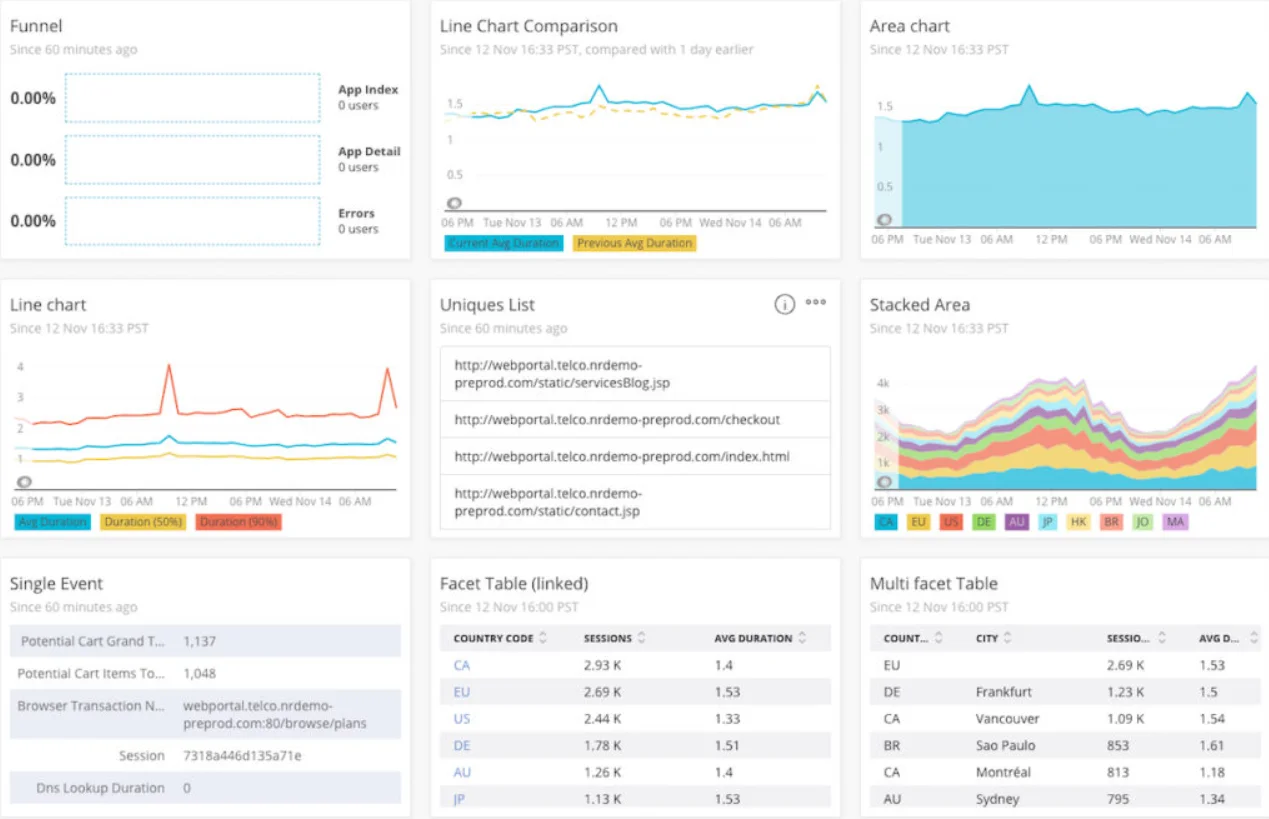
Image: New Relic dashboard example
Designed for deep application insights, New Relic also features a powerful NRQL (New Relic Query Language), which offers advanced querying capabilities beyond what Datadog provides.
Additionally, its custom dashboards support real-time data updates so your team can monitor live application performance and user interactions.
2. Incident management
Some key incident management tools that Datadog offers include:
- End-to-end management. You can declare, investigate, and resolve incidents directly within the platform, minimizing context-switching. You can also collaborate with distributed teammates in real-time through dedicated Slack channels and interactive timelines that capture all relevant incident data.
- Automated workflows. You can create customizable notification rules that alert relevant stakeholders based on incident severity and other criteria.
- Postmortem notebooks. After resolving an incident, your team can automatically generate postmortems, preserving valuable data and insights for future reference. This feature lets you pull graphs and metrics from various sources for comprehensive analysis.
On the other hand, New Relic focuses on application performance and integrates incident management within its APM suite:
- Issues feed. This feature gives you an overview of all incidents, including their status, correlations, and detailed analyses. Your team can search and filter issues based on criteria such as priority and entity ID.
- Incident intelligence. New Relic automatically groups incidents into broader issues, helping your team understand the underlying problems more effectively.
- Postmortem analysis. This feature automatically collects data related to incidents, streamlining root cause analysis and mitigation strategies.
Additionally, New Relic offers customizable workflows for notifications, allowing your team to direct alerts to the appropriate personnel based on the nature of the incident.
3. Performance and scalability
New Relic is designed to collect over 20 billion metrics daily and can consistently ingest 100,000 metrics per second. Its multi-tenant SaaS model ensures rapid data processing, maintaining an average page load time of about 1.5 seconds.
This architecture employs various agents tailored for different monitoring needs — APM, infrastructure, and browser monitoring — allowing for detailed performance tracking at the code level.
The underlying database, NRDB, enables you to analyze tens of billions of events per second with low-latency query response times. New Relic’s capabilities also include alerting features that allow you to set thresholds on performance indicators like the APDEX score and error rates.
Datadog’s architecture supports a distributed and fault-tolerant system capable of managing millions of data points per second. You can customize your monitoring setups at scale using tags and attributes.
The Datadog Agent, built with Go, optimizes data processing efficiency and can handle up to 200,000 DogStatsD metrics per second on modest cloud VMs. Recent improvements have reduced CPU usage, enabling the agent to process more metrics without additional resources.
4. Integrations and OpenTelemetry Support
Datadog boasts over 1,000 built-in integrations, allowing extensive data collection from a wide range of services and applications. These integrations span various areas, including clouds, operating systems, data stores, and AI platforms.
Here’s a closer look:
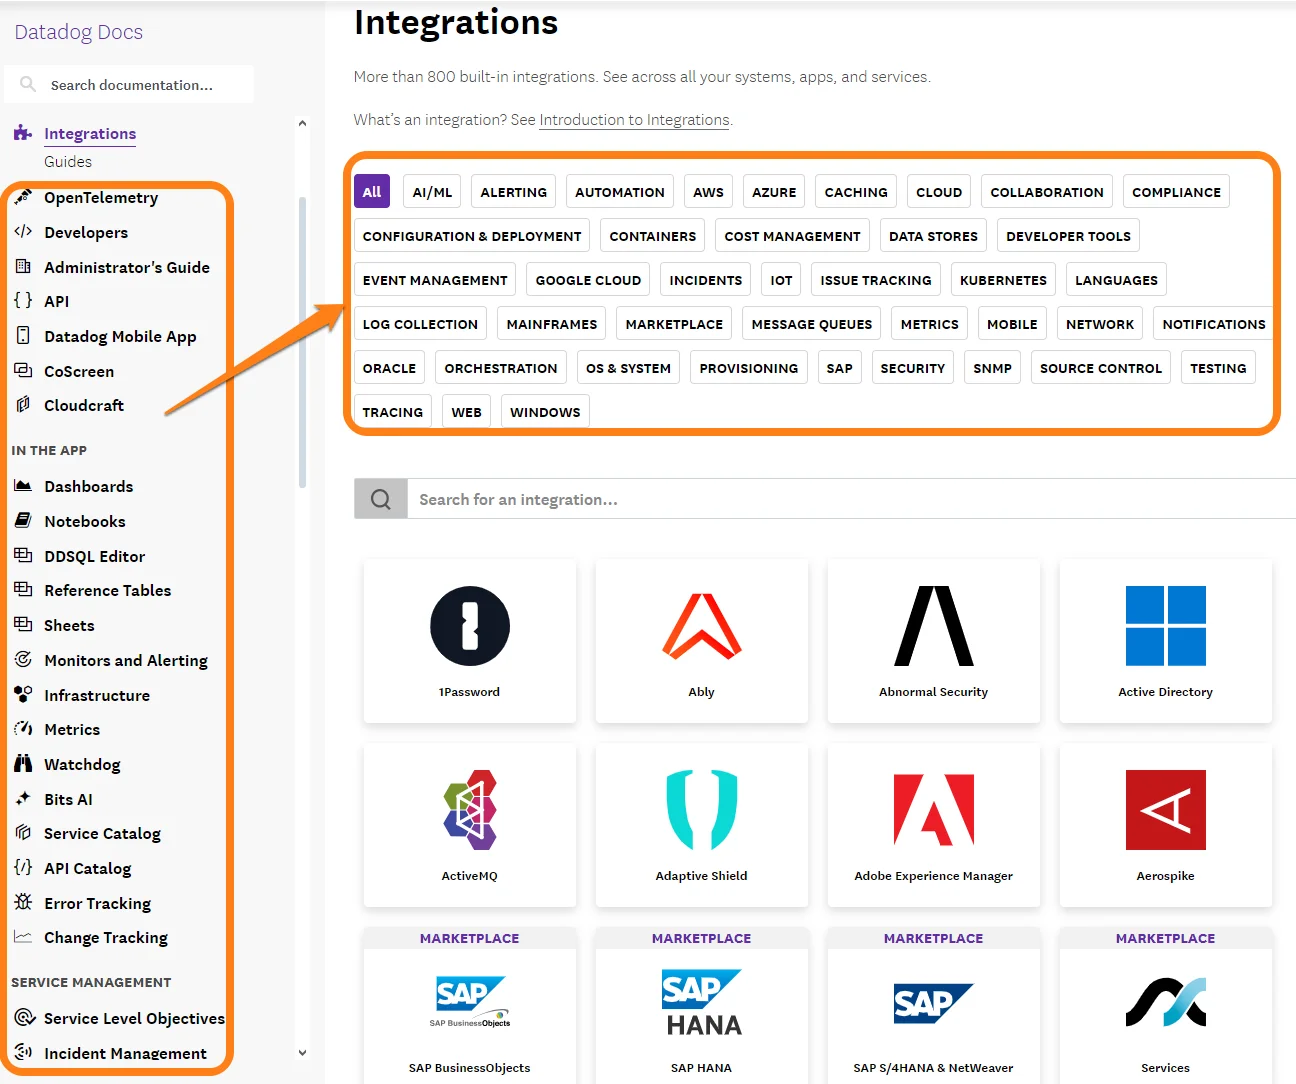
Image: Datadog integrations
Similarly, New Relic supports over 800 integrations, so you’ll likely have sufficient coverage for data ingestion across multiple sources.
Both platforms support OpenTelemetry, the open-source observability framework that is becoming an industry standard for instrumenting applications. New Relic has invested heavily in native OpenTelemetry support, accepting OTLP data directly and treating it as a first-class citizen within its platform. Datadog also accepts OpenTelemetry data, though its ecosystem still centers on its proprietary Datadog Agent for primary instrumentation. If your team has already standardized on OpenTelemetry or plans to, this distinction may influence your decision.
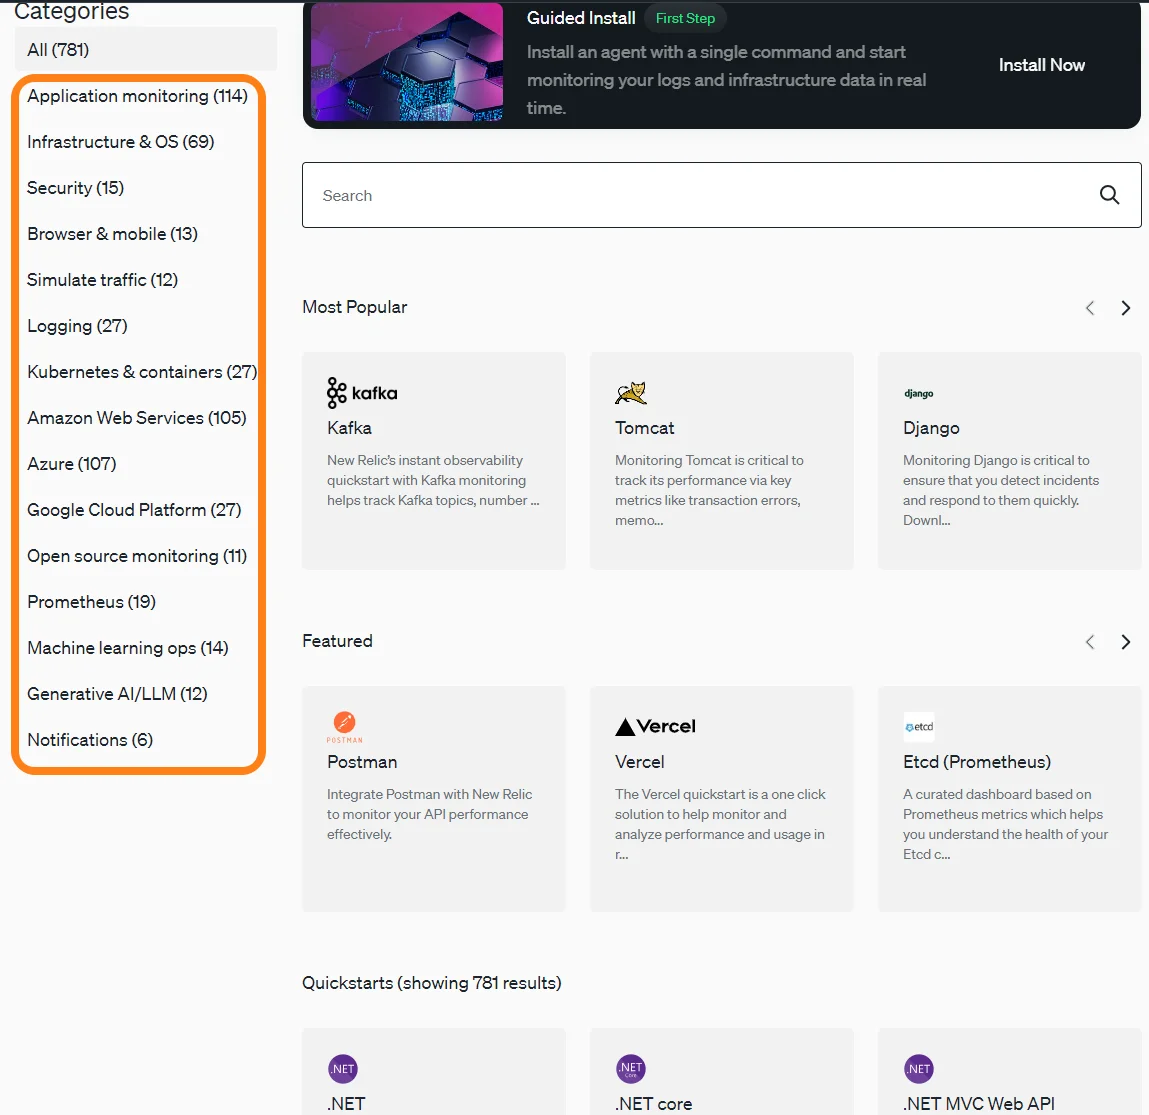
Image: New Relic integrations
5. AI and Machine Learning Capabilities
Both Datadog and New Relic have expanded their AI and ML tooling significantly. Datadog offers Watchdog, an automated anomaly detection engine that surfaces performance issues across your infrastructure without manual threshold configuration. In 2025, Datadog also introduced Bits AI, a natural language assistant for querying and investigating incidents.
New Relic countered with its own AI-driven features, including an AI-powered SRE Agent (launched in preview in early 2026) designed to assist with incident response. New Relic’s approach emphasizes augmenting human judgment rather than automating production changes, positioning its AI tools as a co-pilot rather than an autonomous operator.
If AI-assisted observability is a priority for your team, both platforms are investing heavily, though their philosophies differ.
6. Customer support and community feedback
New Relic and Datadog generally receive positive feedback for their customer service, particularly during and after onboarding. While responsiveness may fluctuate as you scale, you typically receive knowledgeable technical support once you connect with a customer representative.
Both platforms have large, vibrant user communities, extensive plugins, and detailed documentation. However, users often find New Relic’s knowledge base more organized, which can be particularly helpful when trying to deepen your understanding of the platform.
However, some users have concerns about aggressive upselling and occasional changes to user-related policies.
7. Pricing
New Relic uses a usage-based pricing model, with actual billing determined by user types (Basic, Core, Full Platform), New Relic Edition (Standard, Pro, Enterprise), and the volume of data ingested each month (per GB). New Relic also offers an alternative Core Compute billing model (currently in public preview), which charges based on compute resources consumed rather than per-user seats.
- We’ve broken down the differences in New Relic user types and billing in this New Relic pricing guide.
- You can also check our New Relic cost optimization guide to learn how to maximize NR without overspending.
Datadog’s tiered pricing structure depends on several cost factors, including the number of monitored hosts, the volume of logs and metrics ingested, and the specific features selected. Datadog charges separate fees for its monitoring capabilities, including infrastructure, apps, logs, security, digital experience, software delivery, service management, and AI observability.
- For more details, check our Datadog pricing guide here.
- Also, see this guide to Datadog cost optimization best practices to minimize waste and maximize ROI.
For example, Infrastructure monitoring is available in Pro and Enterprise tiers. The Pro tier costs $15 per host per month when billed annually, while the Enterprise tier is priced at $23 per host per month. For month-to-month billing, the Pro and Enterprise tiers cost $18 and $27 per host per month, respectively.
But that’s not all you’ll pay for when using Datadog or New Relic.
When to Choose Datadog vs. New Relic
Choosing between these platforms often comes down to your team’s priorities and environment:
Choose Datadog if your organization runs a complex, multi-cloud infrastructure and values breadth of integrations. Datadog’s 1,000+ integrations and granular infrastructure monitoring make it a strong fit for platform engineering teams that need deep visibility across diverse tech stacks. Its modular pricing also lets you pay only for the capabilities you need, though costs can escalate quickly if usage isn’t monitored.
Choose New Relic if your team prioritizes application-level performance insights and wants predictable pricing. New Relic’s all-in-one approach — where every feature is available to Full Platform users — reduces the surprise billing that plagues Datadog adopters. Its NRQL query language and strong OpenTelemetry support also make it appealing for teams that want flexibility in instrumentation.
Consider alternatives if neither platform fully aligns with your budget or observability philosophy. Tools like Grafana, SigNoz, or Dynatrace each take a different approach to pricing, open-source compatibility, and AI-driven operations.
Cloud Cost Optimization For Datadog And New Relic
Due to their high scalability, Datadog and New Relic costs can quickly spiral out of control and burn a hole in your budget if left unmanaged.
Managing these costs continuously to protect your margins is impractical in today’s fast-paced environment. Yet, traditional cloud cost monitoring tools often fall short, failing to provide the full scope and granular details needed to uncover who, what, and why your observability costs are skyrocketing.
So, if rising New Relic or Datadog costs keep you up at night, or if you know there’s room to optimize but aren’t sure where to start, CloudZero can help.
Here’s why (and how):
- Seamless integration. CloudZero’s cloud-native and serverless design works seamlessly with Datadog and New Relic compared to traditional cost management tools.
- Robust data analytics. Ingest massive amounts of data from anywhere, at any scale, to eliminate observability cost blind spots. CloudZero enriches and organizes this data, presenting it in ways that each stakeholder can understand and act on immediately.
- Unit cost intelligence. Get granular, actionable cost insights like cost per request, customer, feature, and deployment. Understand who, what, and why your bill changes so you can tell exactly what to do next to fix it.
- No additional tools, dashboards, or switching is required. Unify costs from different clouds and platforms like Snowflake, Databricks, and MongoDB alongside your Datadog or New Relic spend data — all in one place for easier analysis.
- Real-time anomaly detection. Receive timely, noise-free, and context-rich alerts for cost anomalies. Catch issues at their source to prevent overspending.
Reading about CloudZero is one thing — experiencing it firsthand is entirely another. See the New Relic integration here or the Datadog integration here. Better yet,  , and discover why innovative brands like Drift, MalwareBytes, and Wise trust CloudZero to optimize their cloud costs.
Frequently Asked Questions about Datadog vs. New Relic