

Abstract
The origin of life on Earth would benefit from a prebiotic atmosphere that produced nitriles, like HCN, which enable ribonucleotide synthesis. However, geochemical evidence suggests that Hadean air was relatively oxidizing with negligible photochemical production of prebiotic molecules. These paradoxes are resolved by iron-rich asteroid impacts that transiently reduced the entire atmosphere, allowing nitriles to form in subsequent photochemistry. Here we investigate impact-generated reducing atmospheres using new time-dependent, coupled atmospheric chemistry and climate models that account for gas-phase reactions and surface catalysis. The resulting H2-, CH4-, and NH3-rich atmospheres persist for millions of years, until the hydrogen escapes to space. The HCN and HCCCN production and rainout to the surface can reach 109 molecules cm−2 s−1 in hazy atmospheres with a mole ratio of CH4/CO2 > 0.1. Smaller CH4/CO2 ratios produce HCN rainout rates of <105 molecules cm−2 s−1 and negligible HCCCN. The minimum impactor mass that creates atmospheric CH4/CO2 > 0.1 is 4 × 10²⁰–5 × 10²¹ kg (570–1330 km diameter), depending on how efficiently iron reacts with a steam atmosphere, the extent of atmospheric equilibration with an impact-induced melt pond, and the surface area of nickel that catalyzes CH4 production. Alternatively, if steam permeates and deeply oxidizes the crust, impactors of ∼1020 kg could be effective. Atmospheres with copious nitriles have >360 K surface temperatures, perhaps posing a challenge for RNA longevity, although cloud albedo can produce cooler climates. Regardless, postimpact cyanide can be stockpiled and used in prebiotic schemes after hydrogen has escaped to space.

Original content from this work may be used under the terms of the Creative Commons Attribution 4.0 licence. Any further distribution of this work must maintain attribution to the author(s) and the title of the work, journal citation and DOI.
1. Introduction
Two essential aspects of life are a genome and catalytic reactions, so the presence of ribonucleotide molecular “fossils” in modern biochemistry (White 1976; Goldman & Kacar 2021) and the ability of RNA to store genetic information and catalyze reactions have led to the hypothesis that RNA-based organisms originated early (Gilbert 1986; Cech 2012). This hypothesis proposes a stage of primitive life with RNA as a self-replicating genetic molecule that evolved by natural selection, which, at some point, became encapsulated in a cellular membrane and may have interacted with peptides from the beginning in the modified hypothesis of the RNA–peptide world (e.g., Di Giulio 1997; Muller et al. 2022). In any case, RNA must be produced abiotically on early Earth for such scenarios. Chemists have proposed several prebiotic schemes that require nitriles—hydrogen cyanide (HCN), cyanoacetylene (HCCCN), cyanamide (H2NCN), and cyanogen (NCCN)—to synthesize ribonucleobases, which are the building blocks of RNA (Sutherland 2016; Benner et al. 2020; Yadav et al. 2020).
Abiotic synthesis of nitriles in nature is known to occur efficiently from photochemistry in reducing N2–CH4 atmospheres (Zahnle 1986; Tian et al. 2011). Indeed, Titan’s atmosphere, composed of mostly N2 and CH4, makes HCN, HCCCN, and NCCN (Strobel et al. 2009).
Geochemical evidence does not favor a volcanic source for a CH4-rich prebiotic atmosphere. Redox proxies in old rocks indicate that Earth’s mantle was only somewhat more reducing 4 billion yr ago (Aulbach & Stagno 2016; Nicklas 2019). Therefore, volcanoes would have mostly produced relatively oxidized gases like H2O, CO2, and N2 instead of the highly reduced equivalents, H2, CH4, and NH3 (Holland 1984; Catling & Kasting 2017; Wogan et al. 2020). Thus, steady-state volcanism would have likely produced Hadean (4.56–4.0 Ga) air with CO2 and N2 as bulk constituents, whereas reducing gases, such as CH4, would have been minor or very minor.
However, Urey (1952) suggested that the prebiotic atmosphere was transiently reduced by large asteroid impacts. In more detail, Zahnle et al. (2020) argued that iron-rich impact ejecta could react with an impact-vaporized ocean to generate H2 (Fe + H2O ↔ FeO + H2). As the H2O- and H2-rich atmosphere cools, their chemical equilibrium modeling with parameterized quenching finds that H2 can combine with atmospheric CO or CO2 to generate CH4. After several thousand years of cooling, the steam condenses to an ocean, leaving a H2-dominated atmosphere containing CH4. Zahnle et al. (2020) used a photochemical box model to show that such a reducing atmosphere would have generated prebiotic molecules like HCN. The reducing atmospheric state terminates when H2 escapes to space after millions of years.
Model simplicity in Zahnle et al. (2020) left critical questions unanswered. Their model of a cooling steam postimpact atmosphere did not explicitly simulate chemical kinetics pertinent to Earth, which may inaccurately estimate the generated CH4. Additionally, their photochemical box model did not include all relevant reactions or distinguish between different prebiotic nitriles (e.g., HCN and HCCCN). Finally, Zahnle et al. (2020) only crudely computed the climate of postimpact atmospheres, yet surface temperature is important for understanding the possible fate of prebiotic feedstock molecules. These molecules are needed to initiate prebiotic synthesis and must be available in the prebiotic environment.
Here we improve upon the calculations made in Zahnle et al. (2020) using more sophisticated and accurate models of postimpact atmospheres. We estimate postimpact H2 production by considering reactions between the atmosphere and delivered iron and equilibration between the atmosphere and impact-generated melt. Our model explicitly simulates the 0D chemical kinetics of a cooling steam atmosphere considering gas-phase reactions, as well as reactions occurring on nickel surfaces that catalyze CH4 production, given that nickel is expected to be delivered by big impactors. After the postimpact steam condenses to an ocean, we simulate the long-term evolution of a reducing atmosphere with a 1D photochemical-climate model, quantifying HCN and HCCCN production and the climate in which they are deposited on Earth’s surface. Additionally, we discuss the possible fate and preservation of prebiotic molecules in ponds or lakes on Hadean land. Finally, we discuss how “lucky” primitive life was if created by postimpact molecules, given a need to not be subsequently annihilated by further impactors.
2. Methods
We organize our investigation of postimpact Hadean atmospheres into the three phases of atmospheric evolution depicted in Figure 1. Below, we briefly describe our numerical models for each phase, and complete descriptions can be found in the Appendix.
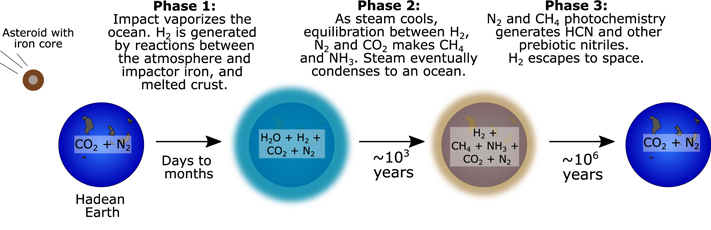
Figure 1. Three phases of atmospheric evolution after a large asteroid impact on the Hadean Earth. In phase 1, the impactor vaporizes the ocean and heats up the atmosphere. Iron delivered by the impactor reacts with hot steam to make H2. The H2 is also modulated by equilibration between the atmosphere and an impact-generated melt pond. In phase 2, as the steam-rich atmosphere cools for thousands of years, H2 reacts with CO2 to make atmospheric CH4. Ultimately, the steam condenses to an ocean. Finally, in phase 3, N2 and CH4 photochemistry generates HCN and other prebiotic nitriles. The H2-dominated atmosphere escapes to space over millions of years, causing the return of a more oxidizing N2 and CO2 atmosphere.
Download figure:
Standard image High-resolution imageIn phase 1, an impactor collides with Earth, vaporizing the ocean, and H2 is generated by reactions between the atmosphere and iron-rich impact ejecta and atmospheric reactions with an impact-produced melt pond. Our model of this phase (Appendix A) accounts for H2 generation from impactor iron by assuming that each mole of iron delivered to the atmosphere removes one mole of oxygen. For example, Fe can sequester O atoms from steam:

Simulations that consider reactions between the atmosphere and impact-melted crust follow a similar procedure to the one described in Itcovitz et al. (2022). Our model requires that the atmosphere and melt have the same oxygen fugacity. The oxygen fugacity of the melt is governed by relative amounts of ferric and ferrous iron (Kress & Carmichael 1991):

We assume that oxygen atoms can flow from the atmosphere into the melt (or vice versa) and use an equilibrium constant for Reaction (2) from Kress & Carmichael (1991). Finally, we compute a chemical equilibrium state of the atmosphere (or atmosphere–melt system) at 1900 K using thermodynamic data from NIST for 96 gas-phase species (Appendix C.2). The result gives the estimated amount of H2 generated by an impact.
In phase 2 of Figure 1, the steam atmosphere cools for thousands of years, generating CH4 and NH3; eventually, the steam condenses to an ocean. We simulate these events with the 0D kinetics-climate box model fully described in Appendix B. The gas-phase model tracks 96 species connected by 605 reversible reactions (Appendix C.2), but we do not account for photolysis. The model also optionally accounts for reactions that occur on nickel surfaces using the chemical network described in Schmider et al. (2021). As discussed later in Section 3.2, nickel is potentially delivered to Earth’s surface by impacts that might catalyze methane production. In the model, the atmospheric temperature changes as energy is radiated to space and modulated by latent heat released from water condensation. We estimate the net energy radiated to space by using a parameterization of calculations performed with our radiative transfer code (Appendix D).
During phase 3, photochemistry generates HCN and other prebiotic molecules. Hydrogen in the H2-dominated atmosphere escapes to space over millions of years, ushering in the return of a CO2 and N2 atmosphere. We use our time-dependent photochemical-climate model, Photochem (Appendix C), to simulate this phase of atmospheric evolution. The model solves a system of partial differential equations approximating molecular transport in the vertical direction and the effect of chemical reactions, photolysis, condensation, rainout in droplets of water, and hydrogen atmospheric escape. Specifically, the model rains out haze particles and HCN, among a few other atmospheric species listed in Appendix C.2. We simulate diffusion-limited and hydrodynamic hydrogen escape using Equation (47) of Zahnle et al. (2020). Our reaction network (Appendix C.2) acceptably reproduces the steady-state composition of Earth and Titan (Appendix Figure C1). When reproducing the chemistry of Earth and Titan, we fix the temperature profile to measured values, rather than self-consistently computing the climate. We evolve the model equations accurately over time using the CVODE backward differential formula (BDF) method (Hindmarsh et al. 2005). As the atmosphere evolves, we compute self-consistent temperature structures using the radiative transfer code described and validated in Appendix D. Unless otherwise noted in the text, our climate calculations use the opacities in Table 1, which is a subset of the opacities available in our radiative transfer code (Appendix Table D1). Climate calculations do not account for the radiative effects of clouds or hazes. However, our UV radiative transfer for computing photolysis rates does account for haze absorption and scattering.
Table 1. Opacities Used in Climate Modeling
| Line Absorption | Continuum CIA Absorption | Rayleigh Scattering |
|---|---|---|
| H2O, CO2, CH4 | CO2–CO2, N2–N2, CH4–CH4, H2–CH4, H2–H2, H2O–H2O, H2O–N2 | N2, CO2, H2O, H2 |
Download table as: ASCIITypeset image
3. Results
The following sections simulate the three postimpact phases of atmospheric evolution shown in Figure 1 for impactor masses between 1020 and 1022 kg (360–1680 km diameter) under various modeling assumptions.
3.1. Phase 1: Reducing the Steam-generated Atmosphere with Impactor Iron
Within days, a massive asteroid impact would leave the Hadean Earth with a global ∼2000 K rock and iron vapor atmosphere, the iron derived from the impactor’s core (Itcovitz et al. 2022). In the following months to years, energy radiated downward from the silicates would vaporize a large fraction of the ocean, adding steam to the atmosphere (Sleep et al. 1989). At this point, the steam should rapidly react with iron to generate H2. Eventually, the iron vapor and then rock would rain out, leaving behind a steam-dominated atmosphere containing H2, as well as CO2 and N2 from the preimpact atmosphere. The sequence of metal followed by silicate condensation with falling temperature is loosely analogous to the well-known condensation sequence of the solar nebula.
Furthermore, the massive impact would generate a melt pool on Earth’s surface inside the impact crater, which may contain reducing impact-derived iron. The atmosphere and melt pool could react to a redox-equilibrium state. This could add or sequester H2 from the atmosphere, depending on whether the melt was more or less reducing than the atmosphere (Itcovitz et al. 2022).
Recently, Itcovitz et al. (2022) used a smoothed particle hydrodynamics (SPH) code with 0.5 × 10⁶–3 × 10⁶ particles of 150–250 km diameter to estimate the amount of H2 generated as these processes unfold under several different impact scenarios on the Hadean Earth. In their fiducial case (i.e., their model 1A), they assumed that 100% of the iron delivered by an impactor is available to react and reduce a postimpact steam atmosphere. In another scenario, they assumed that only ∼15%–30% of the impactor iron reacts with the steam atmosphere based on their SPH simulations (their model 1B; Citron & Stewart 2022). For both cases, they also considered equilibration between the atmosphere and a melt pool (their models 2, 3A, and 3B). In their simulations, the melt pool is extremely reducing or more oxidizing, depending on whether they assumed that it contains a fraction of the impactor’s iron, and they used SPH models to predict the amount of iron accreted to the melt pool (Citron & Stewart 2022). Overall, they concluded that melt–atmosphere equilibration generates about as much H2 as their fiducial case as long as the iron delivered to the melt–atmosphere system can equilibrate. However, if iron delivered to the melt pool sinks into Earth and cannot react with the atmosphere, then approximately 2–10 times less H2 is produced compared to their fiducial scenario (see the erratum in Itcovitz et al. 2022).
Itcovitz et al. (2022) considered impactors between 2 × 10²¹ and 2 × 10²² kg and assumed that the preimpact Earth has 1.85 oceans of water, 100 bars of CO2, and 2 bars of N2. However, we investigate impacts as small as 1020 kg, and our nominal model (Table 2) assumes only 0.5 bar of preimpact CO2 motivated by models of the Hadean carbonate-silicate cycle (Kadoya et al. 2020) and assuming that little mantle-hosted carbonate is vaporized. Therefore, we use a similar model (Appendix A) to the one described in Itcovitz et al. (2022) to predict the postimpact H2 for our alternative model assumptions (Table 2) and impactor sizes. Figure 2 shows the results.
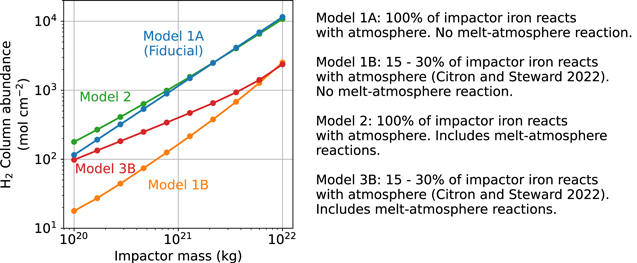
Figure 2. Postimpact H2 generation as a function of impactor mass under different modeling assumptions. Models 1A, 1B, 2, and 3B are identical to those described in Figure 1 of Itcovitz et al. (2022). The simulation’s preimpact volatile inventories, impact angle, and impact velocity are listed in Table 2. In model 1A, all iron delivered by an impact reacts with steam to produce H2. The resulting atmosphere does not equilibrate with an impact-generated melt pool. Model 1B assumes that a fraction (∼15%–30%) of the impactor iron reduces the steam atmosphere based on SPH simulations (Citron & Stewart 2022) and that the atmosphere is chemically isolated from a melt pool. Model 2 is like model 1A while also including postimpact equilibration with a melt pool with a redox state of ΔFMQ-2.3 to represent peridotite (Itcovitz et al. 2022). Model 3B assumes that a fraction (∼15%–30%) of the impactor iron reacts with the steam atmosphere based on SPH simulations and includes melt–atmosphere redox equilibration with a pool magma initially at ΔFMQ-2.3. As stated in Section 3.1, we nominally assume model 1A throughout the main text calculations. We also include simulations in the Appendix that instead adopt model 1B, which we consider to be a plausible lower bound for postimpact H2 generation.
Download figure:
Standard image High-resolution imageTable 2. Nominal Model Assumptions
| Parameter | Symbol | Value |
|---|---|---|
| Preimpact ocean inventory |

| 1.5 × 10⁴ mol cm−2 (i.e., 1 ocean) a |
| Preimpact CO2 inventory |

| 12.5 mol cm−2 (i.e., 0.5 bar) b |
| Preimpact N2 inventory |

| 36 mol cm−2 (i.e., 1 bar) c |
| Impactor mass | Mimp | 1020–1022 kg |
| Iron mass fraction of the impactor | mFe,imp | 0.33 |
| Fraction of iron that reacts with atmosphere | XFe,atmos | 1.0 d |
| Impact angle | ⋯ | 45° |
| Impact velocity relative to Earth | ⋯ | 20.7 km s−1 |
| Eddy diffusion coefficient e | Kzz | 106 cm2 s−1 |
| Aerosol particle radius e | ⋯ | 0.1 μm |
| Troposphere relative humidity | ϕ | 1 |
| Surface albedo | As | 0.2 |
| Temperature of the stratosphere | Tstrat | 200 K |
| Rainfall rate | Rrain | 1.1 × 10¹⁷ molecules cm−2 s−1 (modern Earth’s value) |
| HCN deposition velocity f |

| 7 × 10⁻³ cm s−1 |
| HCCCN deposition velocity g |

| 7 × 10⁻³ cm s−1 |
Notes.
a The source and inventory of surface H2O throughout the Hadean is debated (Johnson & Wing 2020; Korenaga 2021; Miyazaki & Korenaga 2022), as is how much water is present on the modern Earth (e.g., Lécuyer et al. 1998 estimated 0.3–3 oceans in Earth’s mantle). Our nominal case of one modern ocean is one possibility among several. b Based on Hadean carbon cycle modeling in Kadoya et al. (2020). c Based on Figure 5 in Catling & Zahnle (2020). d This is the model 1A scenario for H2 production described near the end of Section 3.1 and in Figure 2. e Assumed to be constant as a function of altitude. f Estimated based on the HCN hydrolysis rate in the ocean (Appendix C.4). g Assumed to be the same as HCN.Download table as: ASCIITypeset image
Our calculations give two end-member scenarios for impact H2 production, which we consider for subsequent calculations in this paper. The more optimistic case assumes that 100% of the impactor’s iron reacts with an atmosphere that is chemically isolated from a melt pool (model 1A in Figure 2). Following Zahnle et al. (2020), we adopt this scenario as our nominal model throughout the main text. This assumption produces a similar amount of H2 as an atmosphere–melt system that retains most of the impactor’s iron (e.g., model 2 in Figure 2), which is consistent with Itcovitz et al. (2022). The model 2 calculation assumes that the melt pool has an initial oxygen fugacity of ΔFMQ-2.3, which is appropriate for a peridotite melt (Itcovitz et al. 2022). 5 However, our results are not sensitive to this assumption because, for model 2, initial melt oxygen fugacities between ΔFMQ and ΔFMQ-4 change the generated H2 by a factor of at most ∼1.3.
The less optimistic case for H2 production is model 1B in Figure 2, which assumes that only a fraction of the impactor iron reacts with an atmosphere (∼15%–30%) and that the latter does not react with a melt pool. We compute the fraction of available iron by extrapolating SPH simulations of impacts traveling at twice Earth’s escape velocity and colliding with Earth at a 45° angle (Appendix Figure A1), which is the most probable angle (Citron & Stewart 2022). Most simulations shown in the main text have a complementary figure in the Appendix that makes this alternative pessimistic assumption regarding postimpact H2 generation.
3.2. Phase 2: The Cooling Postimpact Steam Atmosphere
After reactions between impact-derived iron and steam produce H2, the atmosphere would radiate at a rate determined by the optical properties of water vapor (Zahnle et al. 2020). Chemical reactions would initially be rapid, forcing the whole atmosphere to chemical equilibrium. Methane is thermodynamically preferred at lower temperatures (e.g., more methane is preferred in a gas at 1000 K than a gas at 1500 K), so it should become more abundant as the atmosphere cools. Eventually, the atmosphere would reach a temperature where the reactions producing methane would be extremely sluggish compared to the rate of atmospheric cooling. At this point, the methane abundance would freeze, or quench. Ammonia would exhibit the same behavior as methane by initially rising in abundance and then quenching when the kinetics become slow. After several thousand years, water vapor condenses and rains out of the atmosphere to form an ocean.
We use the 0D kinetics-climate box model described in Appendix B to simulate these events. By simulating each elementary chemical reaction, the model automatically computes methane and ammonia quenching as the atmosphere cools and temperature-dependent reactions slow. We first consider gas-phase kinetics; later, we will also consider nickel-surface kinetics.
Figure 3 shows our model applied to a 1.58 × 10²¹ kg (∼900 km diameter) impactor. As the steam cools, ammonia quenches when the atmosphere is ∼1200 K, followed by CH4 quenching at ∼950 K. After quenching, nearly half of the total carbon in the atmosphere exists as CH4. After 4200 yr, the steam has largely rained out to form an ocean, leaving behind a H2-dominated atmosphere containing CH4 and NH3. The NH3 is soluble in water, so a fraction should be removed from the atmosphere by dissolution in the newly formed ocean; however, our simulations (e.g., Figure 3) do not account for this effect.
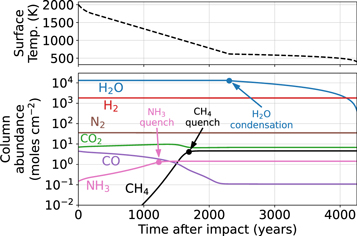
Figure 3. Kinetics-climate simulation of a cooling steam atmosphere caused by a 1.58 × 10²¹ kg impactor. The model uses the Table 2 nominal parameters. The top panel is surface temperature, and the bottom panel shows atmospheric composition.
Download figure:
Standard image High-resolution imageFigure 4 shows the predicted atmospheric composition at the end of the steam atmosphere (e.g., at 4200 yr in Figure 3) as a function of impactor mass. The calculations use gas-phase reactions and our nominal model parameters (Table 2), including the assumption that 100% of the iron delivered by the impactor reacts with the steam atmosphere to make H2. For example, a 1020 kg impactor generates 1.2 × 10² H2 moles cm−2, which would have a partial pressure of 1.2 bars if the atmosphere did not contain water vapor. A 1022 kg impactor generates 1.1 × 10⁴ H2 moles cm−2, which would have a “dry” partial pressure of 23.8 bars. 6 We find that most of the CO2 in the atmosphere is converted to CH4 for impactors larger than 1.6 × 10²¹ kg (∼900 km diameter), and that bigger impacts generate more NH3; e.g., a 1022 kg impactor makes 0.013 “dry” bars of NH3. Reduced species like CH4 and NH3 are thermodynamically preferred in the thick H2 atmospheres generated by bigger impacts. Large impacts generate large amounts of hydrogen because they deliver more iron, which more thoroughly reduces the atmosphere.
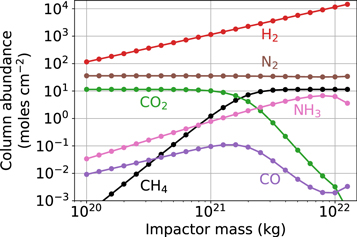
Figure 4. Predicted atmospheric composition as a function of impactor mass after steam has condensed to an ocean. We use our nominal modeling assumptions (Table 2), as well as gas-phase kinetics. Most CO2 is converted to CH4 for impactors larger than 1.6 × 10²¹ kg.
Download figure:
Standard image High-resolution imageThe Figure 4 calculations might underestimate the CH4 produced in the postimpact atmosphere because they ignore reactions occurring on nickel surfaces that can catalyze CH4 generation. If the impactors that struck the Earth during the Hadean resembled enstatite chondrite or carbonaceous chondrite composition, they would have contained 1%–2% nickel (Lewis 1992, Table 15). This nickel would have coexisted with the rock and iron vapor atmosphere that lasted months to years following a massive impact (phase 1 in Figure 1). Metals, along with silicates, would have rained out as spherules covering the entire planet (Genda et al. 2017). As the impact-generated steam cooled, chemical reactions catalyzing CH4 production could have occurred on nickel surfaces in the bed of spherules (Schmider et al. 2021). These surface reactions could lower the quench temperature of CH4, causing more of the gas to be produced.
To estimate the effect of nickel catalysis on CH4 production, we use our kinetics-climate box model (Appendix B) with the nickel-surface reaction network developed by Schmider et al. (2021). The network is based on quantum chemistry calculations and about a dozen experiments from the literature. Our microkinetics approach is distinct from the empirical one taken by, e.g., Kress & McKay (2004) because our model tries to capture each elementary step of catalysis, rather than use a parameterization that is specific to certain experimental conditions.
Figure 5 shows the quenched methane abundance as a function of impactor mass predicted by our model that includes nickel catalysts. The amount of CH4 generated depends strongly on the amount of available nickel surface area. Nickel areas bigger than 0.1 cm2 nickel cm−2 Earth permit more CH4 production compared to our gas phase–only model. Assuming a nickel area of 1000 cm2 nickel cm−2 Earth, a Vesta-sized impactor (2.6 × 10²⁰ kg, 500 km diameter) could convert most CO2 in the preimpact atmosphere to CH4.
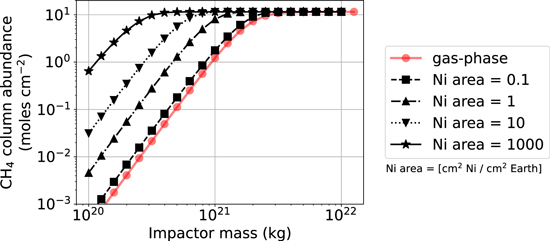
Figure 5. Effect of nickel catalysts on postimpact methane production. The calculations use the Table 2 model parameters and the Schmider et al. (2021) surface reaction network. Nickel areas larger than 0.1 cm2 nickel cm−2 Earth generate more methane than our model that uses gas-phase reactions, e.g., Figure 4.
Download figure:
Standard image High-resolution imageUnfortunately, a precise nickel surface area is hard to estimate. The correct value depends on how the rock, iron, and nickel spherules mix and precipitate to the surface and, furthermore, how effectively the atmosphere can diffuse through and react on exposed nickel. We do not attempt to compute these effects here and instead estimate possible upper bounds. Consider a 2.6 × 10²⁰ kg impactor (Vesta-sized) of enstatite chondrite composition containing 2% by mass Ni (Lewis 1992). If all of this nickel is gathered into 1 mm spheres, a plausible droplet size according to Genda et al. (2017), then the total nickel surface area is 3.4 × 103 cm2 nickel cm−2 Earth. An impactor 10 times more massive would deliver 10 times more nickel, resulting in an upper bound Ni area that is 1 order of magnitude larger. Significantly smaller nickel particles are conceivable. There is experimental support for the formation of ultrafine <300 nm particles in the wake of impacts colliding with an ocean (Furukawa et al. 2007). For a Vesta-sized impactor, collecting all nickel into 100 nm particles has a nickel area 6 orders of magnitude larger than the 1 mm case: 3.4 × 109 cm2 nickel cm−2 Earth. Overall, the larger nickel areas shown in Figure 5 may be within the realm of possibility. Alternatively, nickel might be buried by rock and iron when these materials condense out of the postimpact atmosphere, and the <0.1 cm2 nickel cm−2 Earth is available for catalysis. In this case, gas-phase kinetics would determine the conversion of CO2 to CH4.
Figures 4 and 5 optimistically assume that all iron delivered by the impactor reacts with steam to make H2; however, this may not be the case (see Section 3.1). Therefore, in Appendix Figures A2 and A3, we recalculate Figures 4 and 5 but assume that only a fraction of the impactor’s iron reduces the steam atmosphere by extrapolating SPH simulations of impacts (model 1B in Figure 2). The resulting H2, CH4, and NH3 production appears similar but shifted by a factor of ∼5 to larger impactors. The results are shifted by this amount because SPH simulations suggest that approximately one-fifth of the impactor iron is delivered to the atmosphere, while the rest is either embedded in Earth or ejected to space. We consider these supplementary calculations lower bounds for impactor-generated CH4 and NH3.
3.3. Phase 3: Long-term Photochemical-climate Evolution
Several thousand years after a massive impact, the steam-dominated atmosphere would condense to an ocean, leaving behind a H2-dominated atmosphere containing CH4 and NH3 (e.g., at 4200 yr in Figure 3). The reducing atmospheric state should persist for millions of years until the hydrogen escapes (Zahnle et al. 2020).
We simulate the long-term evolution of this hydrogen-rich atmosphere using a coupled 1D photochemical-climate model (Appendix C). Figure 6 shows our model applied to the atmosphere following a 1.58 × 10²¹ kg (∼900 km diameter) impactor. We assume a preimpact atmosphere with 1 bar of N2 and 0.5 bar of CO2 and simulate the cooling steam atmosphere with our kinetics-climate model (Section 3.2). Next, we use the end of the steam atmosphere simulation as initial conditions for our 1D photochemical-climate model.
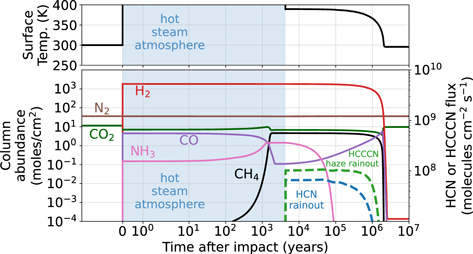
Figure 6. Simulated composition and climate of the Hadean atmosphere after a 1.58 × 10²¹ kg impactor that produces 7.0 bars of H2 once vaporized ocean water condenses. We use the Table 2 model parameters. The blue shaded region labeled “hot steam atmosphere,” also called phase 2 in Figure 1, is simulated by the kinetics-climate model described in Appendix B. After this time period, during phase 3 of a postimpact atmosphere, we evolve the atmosphere with a 1D photochemical-climate model (Appendix C), which maintains 0.018 bar of CH4 between 4 × 10³ and ∼106 yr. Dashed lines are referenced to the right axis. Here “HCN rainout” is HCN molecules raining out in droplets of water, and “HCCCN haze rainout” is the rainout rate of HCCCN incorporated into particles formed from the reaction  . The CH4 and N2 photochemistry generates HCN and HCCCN for about 1 million yr until the H2 escapes to space.
Download figure:
Standard image High-resolution imageWe find that N2 and CH4 photochemistry generates HCN in a hazy Titan-like atmosphere for about 1 million yr until it is halted by hydrogen escape to space. In this model, the dominant channel producing HCN is N + 3CH2
 HCN + H, where 3CH2 is the ground (triplet) state of the methylene radical derived from methane photolysis. There are two other important paths. The first is
 followed by
 , and the second is
 and
 . In all pathways, hydrocarbon radicals (e.g., 3CH2 and CH3) are sourced from photolyzed CH4, and atomic N is derived from photolyzed N2, which both occur at high altitudes (p < 10−5 bars; Appendix Figure A5). The largest chemical loss of HCN is photolysis followed by
 . Other significant losses are paths that form HCCCN haze aerosols. The HCN production and loss in our model is comparable to pathways discussed in similar studies (Zahnle 1986; Tian et al. 2011; Rimmer & Rugheimer 2019). We determined the chemical paths most important for producing and destroying HCN by studying column-integrated reaction rates at 14,200 yr in Figure 6.
In Figure 6, HCN mixes to the surface and rains out in droplets of water at a rate of ∼107 molecules cm−2 s−1. It also dissolves into the ocean at a similar rate, where we assume it is eventually destroyed by hydrolysis (not shown in Figure 6). To emulate HCN dissolution and destruction in the ocean, we assume a 7 × 10⁻³ cm s−1 deposition velocity justified in Appendix C.4. Additionally, a relatively small amount of HCN polymerizes to haze particles in our model via  following Lavvas et al. (2008a), which falls and rains out in water droplets to the surface.
Our results differ from the simulations of Zahnle et al. (2020), which suggested that the duration of HCN production after an impact was limited by the rapid photolysis of methane. The Figure 6 simulation finds that the CH4 lifetime is 4.8 million yr because, following photolysis, CH4 efficiently recombines in a hydrogen-rich atmosphere from the following reaction, which is well known in the atmospheres of the giant planets in our solar system (Appendix Figure A4):

Zahnle et al. (2020) did not account for Reaction (3). The lifetime of cyanide production is therefore instead determined by the timescale of hydrogen escape to space. Significant hydrogen escape permits the destruction of most atmospheric CH4 because Reaction (3) becomes inefficient, which in turn ceases CH4-driven HCN production.
In Figure 6, HCCCN is primarily destroyed by photolysis and produced by the following reaction from acetylene and the cyanide radical:

A fraction of the produced HCCCN reacts to form aerosols via  following Lavvas et al. (2008a). These polymers fall and mix toward the surface, where they rain out in droplets of water at a rate of ∼108 molecules cm−2 s−1. Most gas-phase HCCCN is either destroyed by photolysis or incorporated into aerosols, causing vanishingly small surface HCCCN gas pressures (<10−16 bars).
Our model approximates haze formation with the following three reactions: C2H + C4H2 → polymer + H,  , and
 . At 14,200 yr in Figure 6, the first pathway dominates, forming ∼1.8 × 10¹³ g haze yr−1. At this same point in time, the second and third pathways produce 9 × 10⁷ and 2.8 × 10¹² g yr−1, respectively. The total haze production rate (2.1 × 10¹³ g yr−1) is comparable to the values estimated by Trainer et al. (2006) for the early Earth based on laboratory experiments. Haze particles fall and rain out to the surface, where they can hydrolyze and participate in prebiotic chemistry (Neish et al. 2010; Poch et al. 2012).
In Figure 6, impact-generated ammonia persists for nearly 105 yr. The NH3 is primarily destroyed by photolysis but then recombines from reactions with hydrogen:


Reactions (5) and (6) are relatively efficient in a hydrogen-rich atmosphere. Ammonia photolysis primarily occurs at the 10−3 bar altitude, while haze is largely produced above the 10−5 bar altitude. Therefore, haze particles partially shield ammonia from photolysis, extending the NH3 lifetime (Sagan & Chyba 1997). Our model assumes that the haze particles are perfect spheres with optical properties governed by Mie theory. Observations of Titan’s haze have revealed that hydrocarbon haze particles have a fractal structure that absorbs and scatters UV more effectively than Mie spheres (Wolf & Toon 2010). Therefore, our model likely overestimates NH3 photolysis in postimpact atmospheres.
Figure 6 assumes that all NH3 is in the atmosphere and that it does not rain out, but the gas is highly soluble in water and should dissolve in the ocean, where it hydrolyzes to ammonium,  . In Section 4.4.2, we show that for an atmosphere with 0.3 mol cm−2 NH3 and a 371 K ocean at pH = 7, 4% of the NH3 would persist in the atmosphere, while the rest would be dissolved in the ocean. For a hotter 505 K atmosphere with 6.8 mol cm−2 NH3, only 20% of the ammonia dissolves in the ocean because solubility decreases with increasing temperature (Section 4.4.2). Ammonia dissolution in the ocean would protect it from photolysis, perhaps lengthening the lifetime of ammonia in the atmosphere–ocean system. Overall, since our photochemical-climate model neglects NH3 ocean dissolution and likely overestimates NH3 photolysis, we probably underestimate the lifetime of NH3 in Figure 6.
While HCN and HCCCN are produced in Figure 6, the surface temperature would be ∼390 K, primarily caused by H2–H2 collision-induced absorption (CIA), which has a significant greenhouse effect in thick H2 atmospheres like this one of 8.5 bars total pressure. The atmosphere cools to ∼300 K after the H2 escapes to space.
Figure 7 applies our model to various impactor masses. The results show the Hadean atmosphere 10,000 yr after the postimpact-generated steam atmosphere has condensed to an ocean. We choose 10,000 yr after ocean condensation because this is adequate time for the atmosphere to reach a quasi-photochemical steady state that does not change significantly until the hydrogen escapes (e.g., Figure 6). Figures 7(d) and (e) show a sharp increase in the HCN and HCCCN production for impactors larger than 1021 kg (∼780 km). Such large impacts generate CH4/CO2 > 0.1 (Figure 4), which makes a thick Titan-like haze (Trainer et al. 2006). Haze shielding causes CH4 photolysis to be higher in the atmosphere and closer to N2 photolysis; therefore, the photolysis products of both species can more efficiently combine to make cyanides (Appendix Figure A5). Additionally, HCCCN production requires acetylene (Reaction (4)), which is a haze precursor that accumulates when CH4/CO2 > 0.1. These Titan-like atmospheres have ∼10−9 bar surface HCN and HCN ocean deposition and rainout rates between 107 and 109 HCN molecules cm−2 s−1 persisting on hydrogen escape timescales (>1 million yr). The HCCCN is incorporated into aerosols before raining out to the surface at a rate of up to 109 HCCCN molecules cm−2 s−1.
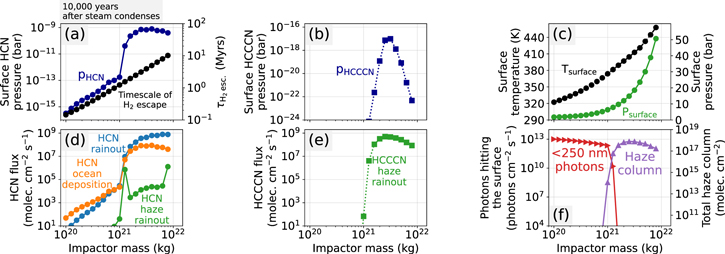
Figure 7. State of the Hadean postimpact atmospheres 10,000 yr after steam condenses to an ocean. This time period is within phase 3 of a postimpact atmosphere indicated in Figure 1. The simulations assume the Table 2 parameters and gas-phase reactions during the cooling steam atmosphere. (a) Surface HCN pressure and timescale of H2 escape, which can be interpreted as the approximate duration of HCN and HCCCN production. (b) HCCCN surface pressure. (c) Surface temperature and pressure. (d) HCN deposition rate in the ocean and the rate at which HCN leaves the atmosphere in rain drops; “HCN haze rainout” is the rainout rate of an aerosol created via the reaction  . (e) Rainout rate of an aerosol formed from the reaction
 . (f) The <250 nm photons hitting the surface and the total hydrocarbon haze column abundance. Impactors larger than 1021 kg produce haze-rich atmospheres and a stepwise increase in HCN and HCCCN production.
Download figure:
Standard image High-resolution imageIn addition to photochemistry, lightning should also generate HCN (Chameides & Walker 1981; Stribling & Miller 1987). Appendix Figure A8 shows HCN production from lightning for the same time period as the Figure 7 simulation using the methods described in Chameides & Walker (1981). Assuming the same lightning dissipation rate as modern Earth’s, we find that lightning produces up to ∼104 HCN molecules cm−2 s−1. This value is small compared to the 107–109 HCN molecules cm−2 s−1 produced from photochemistry after >1021 kg impacts.
Larger impacts generate a thicker H2 atmosphere, which makes the atmosphere warmer (Figure 7(c)). For impactors of >1021 kg, which generate substantial HCN and HCCCN, the surface temperature is >380 K. Figure 7(f) shows that impactors that produce substantial haze shield the surface from <250 nm photons, which means that prebiotic schemes that require high-energy UV light (e.g., Patel et al. 2015) would need to rely on stockpiling of the nitriles for later use.
The Hadean Earth CO2 concentration is uncertain. Models of the Hadean geologic carbon cycle argue for CO2 levels between ∼10−5 and 1 bar at 4 Ga with a median value of ∼0.5 bar and a 95% uncertainty spanning 10−5 to 1 bar (Kadoya et al. 2020). However, these values might be unrealistically small because a large impact would warm surface rocks, possibly causing carbonates to degas, thereby increasing the atmospheric CO2 reservoir. Up to ∼80 bars of CO2 may potentially be liberated from surface carbonates (Krissansen-Totton et al. 2021).
Figure 8 explores the effect of different preimpact CO2 abundances on HCN and HCCCN production in postimpact atmospheres. The simulations are snapshots of the atmosphere 10,000 yr after the impact-vaporized steam has condensed to an ocean. Larger preimpact CO2 causes larger HCN and HCCCN production because it allows more CH4 to form in the cooling steam atmosphere. As discussed previously, CH4 is closely tied to photochemical cyanide generation. Regardless of the preimpact CO2 concentrations, HCN and HCCCN production sharply increases for impactors larger than ∼1021 kg due to more efficient haze production (Figure 7, and corresponding text).
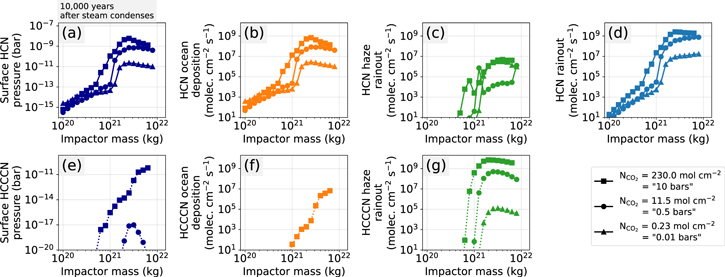
Figure 8. Effect of the preimpact CO2 abundance on HCN and HCCCN production in postimpact atmospheres. All values are for the atmosphere 10,000 yr after the steam condenses to an ocean, which is within phase 3 of a postimpact atmosphere (Figure 1). The simulations assume the Table 1 parameters but vary the preimpact CO2 inventory between 0.01 (triangles), 0.5 (circles), and 10 bars (squares). The calculations use gas-phase chemistry during the cooling steam atmosphere. Panels (a)–(d) show the surface HCN abundance and fluxes, while panels (e)–(g) show HCCCN production. Our model assumes that HCCCN is not soluble in water and does not rain out; therefore, we omit a panel showing HCCCN rainout. Prebiotic nitrile production is directly correlated with the preimpact CO2 inventory.
Download figure:
Standard image High-resolution imageFigure 9 shows the state of the atmosphere after impacts of various size assuming that 10 cm2 nickel cm−2 Earth is present in the steam atmosphere to catalyze methane production. The nickel causes more efficient conversion of CO2 to CH4 compared to the gas phase–only scenario (Figure 7), permitting greater production of HCN and HCCCN for smaller impactors. For example, a 5 × 10²⁰ kg (∼610 km) impactor that accounts for nickel catalysts (Figure 9) has comparable HCN and HCCCN production to a 1.6 × 10²¹ kg (∼900 km diameter) impactor if no nickel catalysts are assumed in the cooling steam atmosphere (Figure 7).
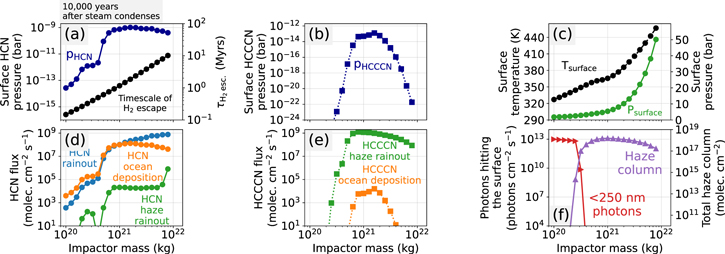
Figure 9. Identical to Figure 7, except that the simulations account for nickel-surface reactions that catalyze methane production as the steam atmosphere cools (Schmider et al. 2021). We assume a nickel surface area of 10 cm2 nickel cm−2 Earth (for context, see Figure 5). Nickel catalysts cause more efficient CH4 generation, permitting greater HCN and HCCCN production for smaller impactors compared to the gas phase–only scenario (Figure 7).
Download figure:
Standard image High-resolution imageA critical assumption in this section is that 100% of the iron delivered by impactors reacts with steam to generate H2. As discussed in Section 3.1, it is possible that the postimpact atmosphere is less thoroughly reduced by impactor iron. Appendix Figures A6 and A7 recalculate main text Figures 7 and 9, assuming that a fraction (approximately 15%–30%) of the impactor iron reduces the steam atmosphere based on SPH simulations (model 1B in Figure 2). This alternative assumption requires that impactors ∼five times more massive are required to generate a haze-rich postimpact atmosphere with copious HCN and HCCCN production. For example, in Figure 7, recall that there is a sharp increase in cyanide production for impactors larger than 1021 kg (∼780 km). Appendix Figure A6, which instead assumes that a fraction of iron reduces the steam atmosphere, finds that the sharp increase in cyanide production occurs for impacts larger than 5 × 10²¹ kg (∼1330 km). However, the presence of nickel catalysts may permit large prebiotic nitrile production for smaller impactors, even under pessimistic postimpact H2 generation (Appendix Figure A7).
4. Discussion
4.1. Comparison to Previous Work
Recently, Zahnle et al. (2020) performed calculations of postimpact atmospheres using simpler models than the ones used in this paper. Our results differ in several important ways. First, we find that our purely gas-phase model of the postimpact steam atmosphere (Section 3.2) predicts less CH4 generation than the model used in Zahnle et al. (2020). For example, Figure 4 predicts that most CO2 is converted to CH4 for impactors larger than 1.6 × 10²¹ kg. Figure 2 (top panel) in Zahnle et al. (2020), which is a comparable scenario, suggests that a 5 × 10²⁰ kg impactor is required to convert most of the atmospheric CO2 to CH4. The difference is likely caused by different approaches to computing CH4 quenching, or freeze-out, as the atmosphere cools. Our kinetics-climate model automatically computes CH4 quenching by tracking the elementary reactions producing and destroying CH4 along with many other atmospheric species. In most of our simulations of cooling postimpact atmospheres, CH4 quenches when the temperature is between 900 and 1000 K. Zahnle et al. (2020) instead used equilibrium chemistry modeling with a parameterization for CH4 quenching derived from kinetics calculations of H2-dominated brown dwarf atmospheres (Zahnle & Marley 2014). This parameterization predicts ∼800 K CH4 quenching temperatures. The different quenching temperatures between our model and the Zahnle et al. (2020) model suggest that the Zahnle et al. (2020) kinetics parameterization is likely not suitable for a cooling steam-rich atmosphere.
The new photochemical model predicts longer postimpact CH4 lifetimes than the Zahnle et al. (2020) model. As mentioned previously, Zahnle et al. (2020) included CH4 photolysis but neglected Reaction (3), which efficiently recombines photolysis products in hydrogen-rich atmospheres. In our model, these recombination reactions allow CH4 to persist in most postimpact atmospheres until hydrogen escapes to space (∼millions of years). Zahnle et al. (2020) instead found that CH4 is eradicated from the atmosphere before hydrogen escape.
Finally, nitrile production and rainout in our new model depend strongly on the presence of haze and the CH4/CO2 ratio, which was not the case in Zahnle et al. (2020). Our model finds that up to ∼109 molecules cm−2 s−1 of HCN and HCCCN is rained out in hazy postimpact atmospheres with CH4/CO2 > 0.1 (Figure 7). When CH4/CO2 < 0.1, there is little haze, and HCN production is ∼<105 molecules cm−2 s−1, and HCCCN production is negligible. Haze causes CH4 and N2 photolysis products to be close in altitude so that they efficiently react to make cyanides (Appendix Figure A5). Additionally, HCCCN generation requires C2H2 in our model (Reaction (4)), which is only abundant in hazy atmospheres. In contrast, Zahnle et al. (2020) found that the cyanide production rate in postimpact atmospheres is 108–1010 molecules cm−2 s−1 regardless of the presence of haze and the CH4/CO2 ratio. Our results differ largely because our model is 1D (has vertical transport), while the Zahnle et al. (2020) model is a 0D box model. The HCN production depends on the proximity of CH4 and N2 photolysis, but a box model cannot account for this 1D effect. Furthermore, Zahnle et al. (2020) did not distinguish between different prebiotic nitriles (e.g., HCN and HCCCN) or determine their surface concentrations and rainout rates. Also, Zahnle et al. (2020) did not have a coupled climate model.
Cometary and lightning sources of HCN are relatively small compared to our estimated photochemical production rates in haze-rich postimpact atmospheres. Todd & Öberg (2020) calculated that comets could deliver ∼1.8 × 10⁵ HCN molecules cm−2 s−1 to the Hadean Earth, a value ∼4 orders of magnitude smaller than HCN from photochemistry in our most optimistic models. As discussed in Section 3.3, we find the HCN production from lightning in postimpact atmospheres to be at most ∼104 HCN molecules cm−2 s−1, which is also small compared to UV photochemistry in a CH4-rich atmosphere. This result agrees with Pearce et al. (2022), who also found that lightning-produced HCN is relatively insignificant.
Rimmer & Shorttle (2019) suggested that localized ultrareducing magma rich in carbon and nitrogen might outgas HCN and HCCCN. They imagined this gas interacting with subsurface water, causing high concentrations of dissolved prebiotic molecules and therefore a setting for origin-of-life chemistry. While this idea may have merit, their calculations do not account for graphite saturation in magma, which may inhibit outgassing of reduced carbon-bearing species like HCN (Hirschmann & Withers 2008; Wogan et al. 2020; Thompson et al. 2022). Additionally, Rimmer & Shorttle (2019) did not self-consistently account for the solubility of gases in magma, which has been been hypothesized to prevent the outgassing of H-bearing gases like CH4 or HCN (Wogan et al. 2020). Therefore, we argue that a hypothesized volcanic source of HCN and HCCCN requires further modeling and experiments before it can be compared to a photochemical source but, in general, seems challenging.
Cerrillo (2022) recently used a climate model to predict the surface temperature of postimpact atmospheres with compositions predicted by Zahnle et al. (2020). They found surface temperatures of >600 K in some cases. However, the Cerrillo (2022) calculations do not include the effects of water vapor on the lapse rate in the troposphere. Latent heat from water condensation alters convection in the troposphere, greatly reducing the lapse rate when compared to a dry lapse rate. The result is a much cooler surface. Our climate calculations include the effects of water vapor on the lapse rate, which is why we predict surface temperatures of ≲500 K, even in the wake of a 7.9 × 10²¹ kg impact in Figure 7. All of our climate simulations of postimpact atmospheres allow surface liquid water.
If a postimpact atmosphere of 2000 mol cm−2 H2 is all lost to space (∼4 bars pure H2 atmosphere, or ∼13% of the H2 in an ocean), it would make the D/H of the ocean heavier by 1.4% by hydrodynamic escape and Rayleigh fractionation (following Equation (16) in Zahnle et al. 2019 using an escape fractionation factor of ∼0.9 appropriate for an atmosphere where H2 dominates over CO2). This may be an underestimate of the D/H shift because the immediate postimpact oxidation of iron by steam probably produces H2 with a lower concentration of D than the steam that condenses into an ocean. Experiments show isotopic fractionation in the reaction of iron powder with steam at low temperatures (Smith & Posey 1957), but we are unaware of high-temperature experiments corresponding to postimpact conditions. In any case, cumulative big impacts during the Hadean that created highly reducing atmospheres would be expected to increase oceanic D/H additively, raising the ocean D/H from starting values that were 10% (Piani et al. 2020) to tens of percent (Alexander et al. 2012) lighter than the modern ocean. Such an evolution with intermittent hydrogen escape in the Hadean is consistent both with D/H constraints and with the xenon isotope record (Avice et al. 2018), in which ionic xenon is dragged out to space by early hydrogen escape, and the distribution of xenon isotopes becomes heavier (Zahnle et al. 2019).
4.2. Origin-of-life Setting and Stockpiling of Cyanides
The Hadean Earth may have had less land but was likely speckled with hot-spot volcanic islands similar to modern-day Hawaii (Bada & Korenaga 2018) and possibly had continental land (Korenaga 2021) where nitriles could accumulate. The majority of HCCCN and HCN produced in postimpact atmospheres would dissolve or rain out into the ocean, where it would be diluted and gradually removed by hydrolysis reactions (Miyakawa et al. 2002) or complexation with dissolved ferrous iron (Keefe & Miller 1996). However, some of the nitriles would be deposited in lakes or ponds on land. We consider, first, equilibrium with atmospheric pHCN and, second, time-integrated deposition.
Nitrile concentrations in water bodies on land in equilibrium with the atmosphere according to Henry’s law would be too small to participate in prebiotic schemes that form ribonucleotides. Our models predict HCN surface pressures up to 10−9 bars (Figure 7). For a warm 373 K pond, Henry’s law predicts that the dissolved HCN concentration is 4 × 10⁻¹¹ mol L−1. Yet ∼0.01 mol L−1 HCN is required for polymerization (Sanchez et al. 1967), and published prebiotic schemes can use 1 mol L−1 HCN (Patel et al. 2015).
Additionally, while nitriles are produced in postimpact atmospheres, water bodies on land would likely be too warm for prebiotic chemistry. In the Figure 6 simulation, substantial HCN and HCCCN production occurs in the aftermath of big impacts when the surface temperature is ∼390 K caused by a H2–H2 CIA greenhouse. Nickel catalysts permit big HCN and HCCCN production for surface temperatures as small as ∼360 K (Figure 9). Nucleotide building blocks are fragile at such hot temperatures, and conditions may not be conducive to an RNA world (Bada & Lazcano 2002).
We propose that cyanides produced in hot postimpact atmospheres may instead be preserved, stockpiled, and concentrated and used in prebiotic schemes at a later time, when the climate is colder. Cyanide rainout and stockpiling could occur for millions of years until HCN production is halted by H2 escape to space (Figure 6). For example, if HCN rains out at 109 molecules cm−2 s−1 over 1 million yr (Figure 7), then ∼1.4 g cm−2 HCN could be stockpiled, assuming that all molecules are preserved. Once the H2 escapes, the surface temperature would drop to ∼300 K (Figure 6), and over longer timescales, the carbonate-silicate cycle might settle on even colder climates because impact ejecta promotes CO2 sequestration (Kadoya et al. 2020). In this cold climate, cyanide stockpiled into salts could be released as HCN or CN− into water bodies on land because of rehydration, volcanic or impact heating (Patel et al. 2015; Sasselov et al. 2020), or UV exposure (Todd et al. 2022). Liberation of cyanide could enable the prebiotic schemes that make RNA.
Toner & Catling (2019) investigated a mechanism for stockpiling cyanides. Their thermodynamic calculations show that HCN can be preserved as ferrocyanide salts in evaporating carbonate-rich lakes. However, the Toner & Catling (2019) numerical experiments were at 273 and 298 K, which are far colder environments than the >360 K surface temperatures that coincide with large HCN production in postimpact atmospheres (Figure 9). Although Toner & Catling (2019) did not address stockpiling of HCCCN, cyanoacetylene can be captured by 4,5-dicyanoimidazole (DCI), a byproduct of adenine synthesis, to make crystals of 4,5-dicyanoimidazole (CV-DCI; Ritson et al. 2022), and it is possible that other capture mechanisms are yet to be discovered. Overall, the feasibility of stockpiling prebiotic nitriles in postimpact conditions requires further geochemical modeling and experiments.
4.3. Impactor Size and the Likelihood of the Origin of Life
We hypothesize that CH4/CO2 > 0.1 might be an important threshold required for a postimpact atmosphere to produce useful concentrations of nitriles for origin-of-life chemistry. Figure 10 shows HCN and HCCCN haze rainout as a function of the atmospheric CH4/CO2 mole ratio for every postimpact simulation in this paper. When CH4/CO2 > 0.1, the atmosphere is hazy, and HCN and HCCCN are delivered to the surface at a rate of up to ∼109 molecules cm−2 s−1. In contrast, atmospheres with CH4/CO2 < 0.1 rain out less than 105 HCN molecules cm−2 s−1 and have surface HCN concentrations of less than 10−13 bars (Figure 7). Such small HCN concentrations may be challenging to stockpile as ferrocyanides (Toner & Catling 2019). Additionally, modeled atmospheres with CH4/CO2 < 0.1 produce negligible HCCCN, yet the molecule is required in prebiotic schemes to synthesize pyrimidine (cytosine and uracil) nucleobase precursors to RNA (Powner et al. 2009; Becker et al. 2019; Okamura et al. 2019).
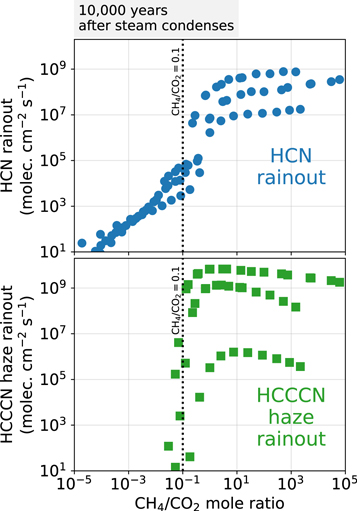
Figure 10. The HCN rainout and HCCCN haze rainout as a function of the CH4/CO2 mole ratio in all simulated postimpact atmospheres. This figure considers the simulations shown in Figures 7, 8, 9, A6, and A7. All values are for the atmosphere 10,000 yr after the steam has condensed to an ocean. The HCN and HCCCN haze production is significantly larger for atmospheres with CH4/CO2 ≳ 0.1.
Download figure:
Standard image High-resolution imageThe impactor mass required to generate an atmosphere with CH4/CO2 > 0.1 is uncertain. Our optimistic model, which considers the effect of nickel-catalyzed methane production, requires a >4 × 10²⁰ kg (>570 km) impactor (Figure 9). The lunar cratering record and abundance of highly siderophile elements in Earth’s mantle imply that between four and seven such impacts occurred during the Hadean (Marchi et al. 2014; Zahnle et al. 2020). Our least optimistic model needs a >5 × 10²¹ kg (>1330 km) impact to create a postimpact atmosphere with CH4/CO2 > 0.1 because it assumes that only a fraction of the iron delivered to Earth reacts with the ocean to create atmospheric H2 (Appendix Figure A6). The Hadean only experienced zero to two collisions this large (Zahnle et al. 2020). The precise minimum impactor mass to make an atmosphere with CH4/CO2 > 0.1 depends on the importance of atmospheric equilibration with a melt pond (Section 3.1; Itcovitz et al. 2022), the fraction of impactor iron that reduces the atmosphere, and the effect of nickel and other surface catalysts on CH4 kinetics.
An additional consideration is that any progress toward the origin of life caused by an impact could be erased by a subsequent impact that sterilizes the planet. For example, suppose a >500 km impact that vaporizes the ocean sterilizes the globe (Citron & Stewart 2022). With our most pessimistic calculations for postimpact CH4 generation, a >1330 km (>5 × 10²¹ kg) impact is required to create an atmosphere that generates significant HCN and HCCCN. In this scenario, the last >1330 km impact favorable for prebiotic chemistry would likely be followed by a 500–1330 km impact that would destroy any primitive life without rekindling it. Alternatively, our optimistic model for postimpact CH4 generation only requires a >4 × 10²⁰ kg (>570 km) impact to create an atmosphere with CH4/CO2 > 0.1. In this case, the final >570 km impact that might kick-start the origin of life is unlikely to be followed by a slightly smaller 500–570 km sterilizing impact.
A caveat to the reasoning in the previous paragraph is that ocean vaporization may not have sterilized the planet because microbes could have possibly survived in the deep subsurface (Sleep et al. 1989; Grimm & Marchi 2018).
In summary, we suggest that CH4/CO2 > 0.1 may be an important threshold for postimpact atmospheres to be conducive to the origin of life because they generate >4 orders of magnitude larger surface HCN concentrations and are the only modeled atmospheres capable of generating HCCCN. We find that the minimum impactor mass required to create a postimpact atmosphere with CH4/CO2 > 0.1 is between 4 × 10²⁰ and 5 × 10²¹ kg (570–1330 km). The value is uncertain for three reasons: (1) we do not know how effectively iron delivered by an impact chemically reduces the atmosphere (Section 3.1); (2) we do not know the importance of atmospheric equilibration with a melt pond (Section 3.1); and (3) it is hard to estimate a realistic surface area of nickel catalysts available during the cooling steam atmosphere (Section 3.2).
4.4. Model Caveats and Uncertainties
4.4.1. Hydrogen from Crust–Atmosphere Reactions
Perhaps the most significant caveat to the modeling effort described above is that we did not consider H2 production from reactions between a hot postimpact atmosphere and solid, nonmelted crust. Section 3.1 explores the impact the H2 made by two mechanisms: (1) reduction of the atmosphere by impact-derived iron and (2) atmospheric equilibration with a melt pond made by the impact. However, it is also conceivable that, while the atmosphere is hot and steam-rich in the ∼103 yr following an impact (i.e., phase 2), water vapor could permeate through and react with the solid crust to produce H2 by a process like serpentinization. Specifically, H2O reduction by FeO in the solid crust could make H2:

In our nominal model (Figures 4 and 7), we require a postimpact atmosphere to have >2 × 10³ H2 mol cm−2 (i.e., the equivalent of converting 13% of Earth’s ocean to H2) in order to reach CH4/CO2 > 0.1 and big nitrile production rates. Assuming a crustal FeO content of 8 wt% (Takahashi 1986), 2 × 10³ H2 mol cm−2 could be produced by reacting water with FeO in the top ∼16 km of Earth’s lithosphere. The feasibility of extensive water–rock H2 generation depends on the permeability of the crust and the pressure gradients driving subsurface fluid circulation. For example, low-permeability rocks with slow water circulation may not permit serpentinization of the upper crust within ∼103 yr while the atmosphere is hot and steam-rich. A comprehensive model is outside the scope of this paper, but if attainable, significant water–rock reactions might produce a thick H2 atmosphere after relatively small impacts (e.g., 1020 kg), which favors CH4/CO2 > 0.1 and significant nitrile generation.
Another possibility, which we do not investigate in detail, is that atmosphere–crust reactions occur in the immediate aftermath of a giant impact (i.e., phase 1), rather than over ∼103 as previously discussed. A large impact could produce a global ejecta blanket of mixed hot water and rock several kilometers thick. As water was vaporized to form a steam atmosphere, the water and rock slurry could chemically equilibrate, producing H2.
Zahnle et al. (2020) attempted to account for atmosphere–crust interaction by equilibrating the postimpact steam atmosphere (phase 2) to a mineral redox buffer. For example, their Figure 5 assumes that the atmosphere has a fixed oxygen fugacity set by the FMQ buffer at an assumed 650 K methane quench temperature. The calculation predicts that most CO2 is converted to CH4 for impacts as small as ∼5 × 10¹⁹ kg, but Zahnle et al. (2020) did not determine whether such significant atmosphere–crust interaction is physically plausible.
4.4.2. Climate
A shortcoming of this work is that our climate model is relatively simple. Throughout Section 3, our climate code assumes an isothermal 200 K stratosphere and saturated adiabatic troposphere (i.e., relative humidity, ϕ = 1.0) and ignores clouds. However, many of our simulated postimpact atmospheres contain a hydrocarbon haze that should absorb sunlight and warm the stratosphere (Arney et al. 2016). Also, in a hydrogen-dominated atmosphere, water vapor has a larger molecular weight compared to the background gas, which could inhibit convection (Leconte et al. 2017) and perhaps cause low relative humidities. Furthermore, low-altitude clouds reflect sunlight and should cool a planet, while high clouds have a greenhouse warming effect (Goldblatt & Zahnle 2011).
Figure 11 attempts to show the uncertainty in our climate calculations as a function of three free parameters: stratosphere temperature, relative humidity, and low-altitude clouds, which we crudely approximate by varying the surface albedo. The calculation uses the composition of the atmosphere after a 5 × 10²⁰ kg impact in Figure 9 immediately after the steam atmosphere has condensed to an ocean. Our nominal climate parameters (Tstrat = 200 K, ϕ = 1, As = 0.2) predict a 361 K surface temperature. A warm stratosphere caused by hydrocarbon UV absorption and high-albedo, low-altitude clouds might cause the surface to be ∼30 K colder than our nominal model, assuming water vapor is saturated. On the other hand, low relative humidities, which might be favored in convection-inhibited H2-dominated atmospheres, increase the troposphere lapse rate, which warms the surface (Leconte et al. 2017). While Figure 11 gives a sense of the possible uncertainty in our climate calculations, it does not self-consistently simulate haze, relative humidity, and cloud feedback. A more comprehensive model is required to resolve these nuances.
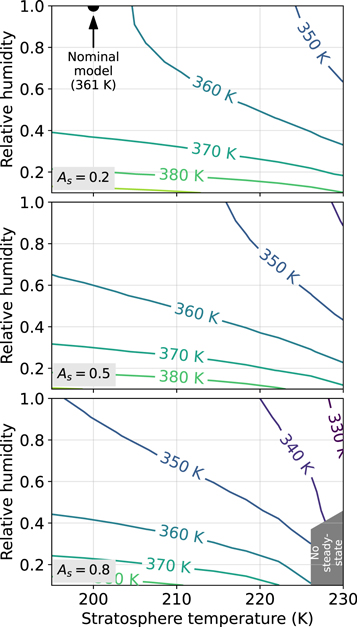
Figure 11. Surface temperature of a postimpact atmosphere as a function of stratosphere temperature, relative humidity, and surface clouds, which we crudely approximate with the surface albedo (Ab ). The atmosphere has 5.9 mol cm−2 CO2, 5.6 mol cm−2 CH4, 35.8 mol cm−2 N2, 556 mol cm−2 H2, 0.01 mol cm−2 CO, 0.3 mol cm−2 NH3, and a liquid water ocean at the surface. This is the same composition of the atmosphere after a 5 × 10²⁰ kg impact in Figure 9 once steam has condensed to an ocean. The gray shaded region labeled “no steady-state” has no steady-state climate solutions that balance incoming shortwave and outgoing longwave energy. Uncertainties in our assumed stratosphere temperature, relative humidity, and the effects of low-altitude clouds predict surface temperatures from ∼330 to ∼390 K with a nominal value of 361 K.
Download figure:
Standard image High-resolution imageA further caveat is that our climate calculations ignore greenhouse warming from NH3 (Table 1). We choose to disregard the influence of NH3 because a substantial fraction of the gas should dissolve in the ocean (Zahnle et al. 2020), a process that our coupled photochemical-climate model cannot self-consistently account for. However, our climate model (Appendix D), when uncoupled to photochemistry, can partition gases between the atmosphere and ocean according to gas solubility and ocean chemistry. Below, we use this stand-alone climate model to determine the climate effects of NH3 in a postimpact atmosphere. The NH3 should dissolve into an ocean by Henry’s law, then hydrolyze to  :



Therefore, the concentration of aqueous NH3 (in mol kg−1) is given by  , where
 is the surface partial pressure of NH3 in bars, and
 is the Henry’s law constant (mol kg−1 bar−1). Reactions (9) and (10) give the ammonium concentration as
 , where K9 and K10 are equilibrium constants for each reaction. The Henry’s law constant for NH3 (in mol kg−1 bar−1) is
 (Linstrom & Mallard 1998). The equilibrium constants for Reactions (9) and (10) are approximately
 and
 . We derived both of these parameterizations using the SUPCRT thermodynamic database (Johnson et al. 1992).
We implement this ocean chemistry into our stand-alone climate model (Appendix D) and compute the surface temperature after the 5 × 10²⁰ kg impact in Figure 9 once the steam atmosphere has condensed to an ocean. The mol cm−2 of each gas are given in the Figure 11 caption. We use our nominal climate parameters (Tstrat = 200 K, ϕ = 1, As = 0.2), assume that the total H2O reservoir is 1 modern ocean (15,000 mol cm−2) with pH = 7, and account for the radiative effects of NH3 in addition to the Table 1 opacities. The model predicts a 371 K surface temperature, which is 10 K warmer than calculations that do not include NH3 opacities or ocean dissolution, and 96% of the ammonia reservoir is dissolved in the ocean.
Ammonia has a more substantial effect on climate after larger impactors. Consider the atmosphere after a 7.9 × 10²¹ kg impact in Figure 5 once steam has condensed to an ocean (0.008 mol cm−2 CO2, 11.5 mol cm−2 CH4, 32.6 mol cm−2 N2, 9122 mol cm−2 H2, 0.002 mol cm−2 CO, and 6.8 mol cm−2 NH3). Our climate model, which includes NH3 opacities and ocean dissolution, predicts a 505 K surface temperature with only 20% of the NH3 dissolved in the ocean because solubility decreases with increased temperature. This is 42 K hotter than our model that ignores NH3 greenhouse contributions (Figure 7). Overall, our climate calculations throughout most of this paper perhaps underestimate the greenhouse warming by 10 to ∼40 K by ignoring NH3 opacities but instead may overestimate surface temperature because they do not account for the cooling effects of haze and low-altitude clouds (Figure 11). Additional warming from NH3 would only be relevant for a fraction of the postimpact atmosphere, before ammonia is destroyed by photolysis (Figure 6).
4.4.3. Unknown Chemical Reactions and the Effect of Ions
While our chemical scheme for HCCCN successfully reproduces the HCCCN abundances in Titan’s atmosphere (Appendix Figure C1), it may lack many reactions relevant to postimpact atmospheres. Our sparse HCCCN network is necessary because few kinetic measurements are currently published in the literature.
Our photochemical model does not include ion chemistry, which is likely a reasonable simplification because ions are not important for HCN or HCCCN formation on Titan (Loison et al. 2015). Only some heavy hydrocarbons, like benzene (C6H6), rely on coupled neutral-ion chemistry to explain their observed abundances in Titan’s atmosphere (Hörst 2017).
5. Conclusions
We use atmospheric models to investigate the production of prebiotic feedstock molecules in impact-generated reducing atmospheres on the Hadean Earth, updating simpler calculations made by Zahnle et al. (2020). We find that massive asteroid impacts can generate temporary H2-, CH4-, and NH3-rich atmospheres, which photochemically generate HCN and HCCCN for the duration of hydrogen escape to space (105–107 yr). The production of nitriles increases dramatically for haze-rich atmospheres that have mole ratios of CH4/CO2 > 0.1. In these cases, HCN can rain out onto land surfaces at a rate of ∼109 molecules cm−2 s−1, and HCCCN incorporated in haze rains out at a similar rate. Atmospheres with CH4/CO2 < 0.1 produce 3–4 orders of magnitude less HCN and generate negligible HCCCN. The impactor mass required to create an atmosphere with CH4/CO2 > 0.1 is uncertain and depends on how efficiently atmosphere–iron, atmosphere–melt, and atmosphere–crust reactions generate H2 and the surface area of nickel catalysts exposed to the cooling steam atmosphere. In an optimistic modeling scenario, a >4 × 10²⁰ kg (>570 km) impactor is sufficient, while in our least optimistic scenario, a >5 × 10²¹ kg (>1330 km) impactor is required.
We find that postimpact atmospheres that generate significant prebiotic molecules have >360 K surface temperatures caused by a H2–H2 greenhouse which may be too hot for prebiotic chemistry, although the temperature may be cooler if reflective clouds occur. An alternative is that HCN and HCCCN generated in a postimpact atmosphere are stockpiled. Cyanide can plausibly be stockpiled and concentrated in ferrocyanide salts, and cyanoacetylene could be captured by by-products of adenine synthesis into imidazole-based crystals (Ritson et al. 2022). The HCN and HCCCN can be used to create nucleotide precursors to RNA millions of years after the impact, once the H2 has escaped to space and the atmosphere has cooled to a more temperate state.
Nominally, the Hadean Earth appears to have experienced several impacts that would have produced an atmosphere that made significant prebiotic feedstock molecules. Like Earth, all rocky exoplanets accreted from impacts. Consequently, impact-induced reducing atmospheres may be a common planetary process that provides windows of opportunity for the origin of exoplanet life.
Acknowledgments
We thank Joshua Krissansen-Totton for numerous conversations that have improved the atmospheric models used in this paper. Conversations with Maggie Thompson, Sandra Bastelberger, and Shawn Domagal-Goldman also helped us create the Photochem and Clima models. We also thank Eric Wolf for advice on computing reliable k-distributions for climate modeling. Additionally, we thank Paul Mollière for conversations that helped us build Clima. Finally, we thank our two anonymous reviewers for constructive feedback that improved this paper. N.F.W. and D.C.C. were supported by Simon’s Collaboration on Origin of Life grant 511570 (to D.C.C.). Also, N.F.W., D.C.C., and K.J.Z. were supported by NASA Astrobiology Program grant 80NSSC18K0829 and benefited from participation in the NASA Nexus for Exoplanet Systems Science research coordination network. N.F.W. and D.C.C. also acknowledge support from Sloan Foundation grant G-2021-14194. R.L. and K.J.Z. were supported by NASA Exobiology grant 80NSSC18K1082. R.L. was additionally supported by NASA XRP 80NSSC22K0953.
Appendix A: H2 Generation from Iron and Molten Crust
Here we describe our model for atmospheric H2 generation in the days to months following a massive asteroid impact (phase 1 in Figure 1). All of our simulations assume a preimpact atmosphere containing CO2, N2, and ocean water. First, we assume that half of the impactor’s kinetic energy heats the atmosphere and ocean water to ∼2000 K. We assume that the atmosphere is heated to ∼2000 K because this is roughly the evaporation temperature of silicates. For our assumed impact velocity of 20.7 km s−1, all impactor masses that we consider in the main text (1020–1022 kg) have kinetic energies of >2 × 1028 J delivering >1028 J to the atmosphere, which is larger than the 5 × 1027 J required to vaporize an ocean (Sleep et al. 1989).
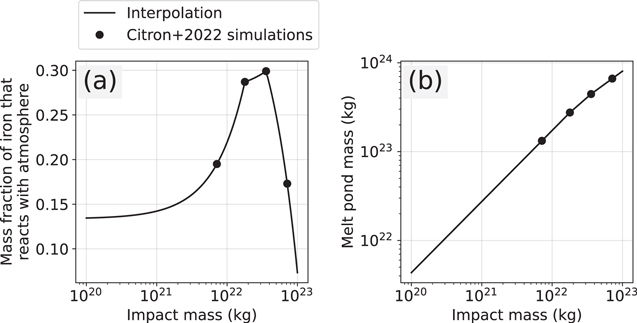
Figure A1. Interpolation and extrapolation of the Citron & Stewart (2022) SPH simulations of impacts that collide with Earth at a 45° angle and with a velocity of twice Earth’s escape velocity. Panel (a) is the mass fraction of iron that reacts with the atmosphere, and panel (b) is the mass of the melt pool produced by an impact. These interpolations are relevant to Figure 2 in the main text and Appendix Figures A2, A3, A6, and A7.
Download figure:
Standard image High-resolution image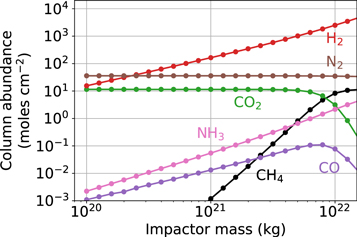
Figure A2. Identical to Figure 4 in the main text but assumes postimpact H2 generation if governed by model 1B described in Figure 2.
Download figure:
Standard image High-resolution image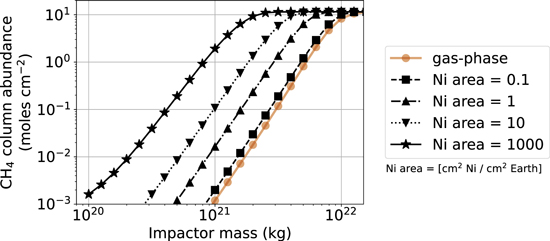
Figure A3. Identical to Figure 5 in the main text but assumes postimpact H2 generation if governed by model 1B described in Figure 2.
Download figure:
Standard image High-resolution image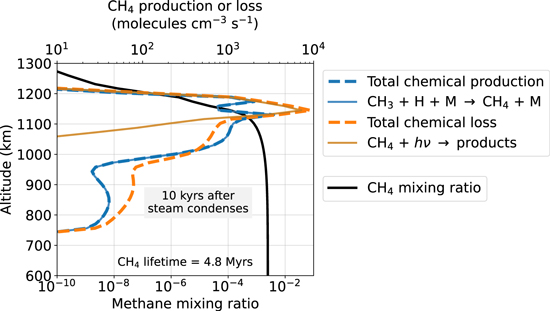
Figure A4. Methane photochemical lifetime in postimpact atmospheres. The plot shows the CH4 mixing ratio and production and loss as a function of altitude 10,000 yr after the steam atmosphere has condensed to an ocean following the 1.58 × 10²¹ kg impact described in Figure 6. The CH4 is primarily destroyed by photolysis but reforms efficiently in the H2-rich atmosphere from CH3 + H + M → CH4 + M. The result is a 4.8 million yr CH4 photochemical lifetime. The CH4 only persists in the atmosphere for about 1 million yr because H2 escapes to space in this amount of time, which inhibits CH4 recombination.
Download figure:
Standard image High-resolution imageNext, our model assumes that each mole of iron delivered reacts with the atmosphere and removes one mole of oxygen. The moles cm−2 of iron delivered to the atmosphere is

Here Mimp is the mass of the impact in grams, XFe,imp is the iron mass fraction of the impact, XFe,atmos is the fraction of the impactor iron that reacts with the atmosphere, μFe is the molar weight of iron, and A⊕ is the area of Earth in square centimeters. Following Zahnle et al. (2020), we take XFe,imp = 0.33. In the main text, we assume XFe,atmos = 1 (e.g., model 1A in Figure 2), while the Appendix contains calculations with XFe,atmos = 0.15–0.3 based on extrapolations of the Citron & Stewart (2022) SPH impact simulations for 45° impactors traveling at 20.7 km s−1 (e.g., model 1B in Figure 2). To approximate equilibration between the delivered iron and the atmosphere, we simply remove NFe,atmos of oxygen atoms from the atmosphere.
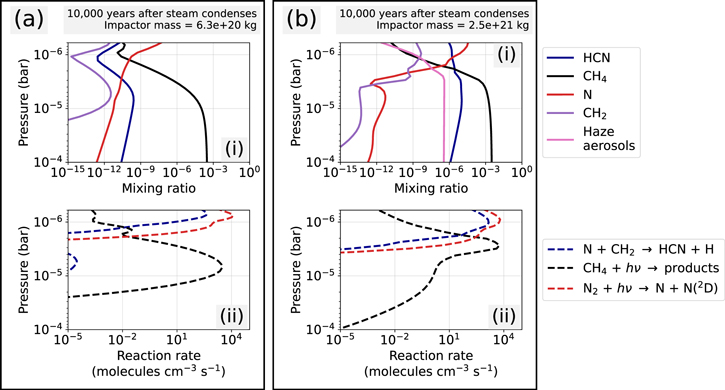
Figure A5. The HCN production and precursor species after a (panel (a)) 6.3 × 10²⁰ and (panel (b)) 2.5 × 10²¹ kg impactor. In both panels, (i) shows mixing ratios, while (ii) shows photolysis and reaction rates. Panel (b) contains haze aerosols that cause CH4 photolysis to be higher in the atmosphere compared to panel (a). High-altitude CH4 photolysis, closer to N2 photolysis, promotes HCN production because photolysis can more readily combine to make cyanides.
Download figure:
Standard image High-resolution image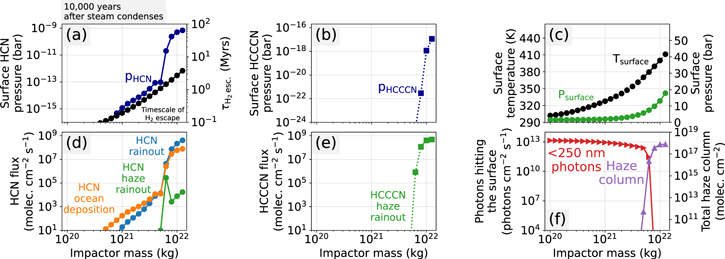
Figure A6. Identical to Figure 7 in the main text but assumes postimpact H2 generation if governed by model 1B described in Figure 2.
Download figure:
Standard image High-resolution image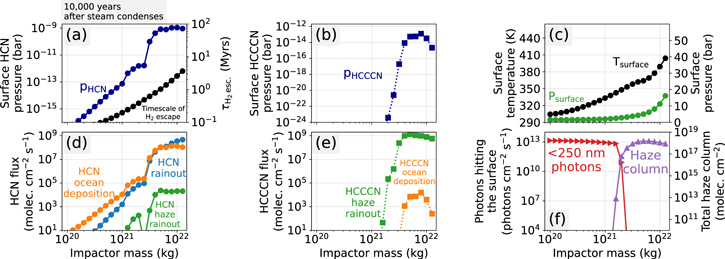
Figure A7. Identical to Figure 9 in the main text but assumes postimpact H2 generation if governed by model 1B described in Figure 2.
Download figure:
Standard image High-resolution imageOur model also optionally considers reactions between the atmosphere and a melt pond generated by the impact. Our approach is similar to the one described in Itcovitz et al. (2022). We estimate the total mass of the melt pond (Mmelt) by interpolating SPH impact simulations from Citron & Stewart (2022) for a 45° impact angle. The smallest impact they considered is 7 × 10²¹ kg, so we extrapolate their results down to 1020 kg. We additionally take the melted crust to be basaltic in composition but with variable initial amounts of ferric and ferrous iron. Effectively, this means that the initial oxygen fugacity of the melted crust is a free parameter because the iron redox state is related to oxygen fugacity through the equilibrium reaction,

We assume that the oxygen atoms can flow from the atmosphere into the melt (or vice versa) in order to bring Reaction (A2) to an equilibrium state defined by Kress & Carmichael (1991) thermodynamic data. Our model also considers H2O gas dissolution in the melt using the Equation (19) solubility relation in Itcovitz et al. (2022).
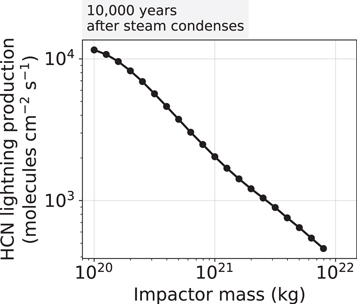
Figure A8. The HCN production from lightning for the same simulations and time period shown in Figure 7. The calculations use methods described in Chameides & Walker (1981) assuming modern Earth’s lightning dissipation rate (9.8 × 10⁻⁹ J cm−2 s−1) and a 2250 K HCN freeze-out temperature. The HCN production from lightning is small compared to what is achievable with photochemistry.
Download figure:
Standard image High-resolution imageFinally, given a heated postimpact atmosphere that has been reduced by impactor iron and, optionally, in contact with a melt pool, we compute the thermodynamic equilibrium of the atmosphere–melt system at 1900 K. We choose 1900 K because any impact-produced silicate vapors should have condensed and rained out of the atmosphere, and the melt pool should have not yet solidified (Itcovitz et al. 2022). To find an equilibrium state, we first compute an equilibrium composition for the atmosphere alone using the equilibrium solver in the Cantera chemical engineering package (Goodwin et al. 2022) with our thermodynamic data (Appendix C.2). Next, to equilibrate the atmosphere–melt system, we perform a 0D kinetics integration for 1000 yr at constant temperature and pressure with our reaction network (Appendix C.2). All reactions in our network are thermodynamically reversible; therefore, integrating the kinetics forward in time should ultimately reach a state of thermodynamic equilibrium. Our integration includes additional reactions representing Reaction (A2) and H2O dissolution in the melt. We arbitrarily choose forward reaction rates of 10−10 s−1 for both reactions, then reverse the rates using the Kress & Carmichael (1991) equilibrium constant and the Equation (19) solubility relation in Itcovitz et al. (2022). Overall, our approach finds a chemical equilibrium state between the atmosphere and the melt pond and therefore an estimation of the amount of H2 generated from atmosphere–iron and atmosphere–melt reactions.
Our code for solving melt–atmosphere equilibrium (Wogan 2023a) is available at Zenodo at doi:10.5281/zenodo.7802966.
Figures A1–A8 are various sensitivity tests of the modeling, as referenced and described in the main text.
Appendix B: Kinetics Model of a Cooling Steam Atmosphere
We simulate the chemistry of a cooling postimpact atmosphere using a 0D kinetics-climate model. We assume that the atmosphere’s composition, pressure, and temperature are homogeneous in all directions and that it has a vertical extent of one atmospheric scale height (Ha ). For these assumptions, the following system of ordinary differential equations governs our model:


All variables and units are in Table B1. In Equation (B1), Ni
is the column abundance of species i in mole cm−2, which changes because of gas-phase chemical reactions (production rate Pi
and loss rate Li
) and reactions occurring on surfaces (Pi,surf and Li,surf). In Equation (B2), T is the surface temperature, which changes because of energy radiated to space (Fnet) and latent heat from H2O condensation  , where
 is the mass of H2O in the atmosphere. We approximate the energy radiated to space in ergs cm−2 s−1 from a steam-dominated atmosphere with the following parameterization:

This parameterization fits the calculations from our radiative transfer model (see Appendix D), which uses a solar spectrum at 4.0 Ga derived from methods described in Claire et al. (2012).
Table B1. Variables
| Variable | Definition | Units |
|---|---|---|
| fi | Mixing ratio of species i | Dimensionless |
| ni | Number density of species i | molecules cm−3 |
| n | Total number density | molecules cm−3 |
| Ni | Column abundance of species i | mol cm−2 |
| N | Total column abundance | mol cm−2 |
| ρ | Density of the atmosphere | g cm−3 |
| cp | Specific heat capacity of the atmosphere | erg g−1 K−1 |
| Fnet | Net radiative energy leaving the atmosphere | erg cm−2 s−1 |
| z | Altitude | cm |
| t | Time | s |
| Pi | Total chemical production of species i | molecules cm−3 s−1 |
| Li | Total chemical loss of species i | molecules cm−3 s−1 |
| Pi,surf | Total chemical production of species i from surface reactions | molecules cm−2 s−1 |
| Li,surf | Total chemical loss of species i from surface reactions | molecules cm−2 s−1 |
| Ri,rainout | Production and loss of species i from rainout | molecules cm−3 s−1 |
| Qi,cond | Production and loss of species i from condensation and evaporation | molecules cm−3 s−1 |
| Φi | Vertical flux of species i | molecules cm−2 s−1 |
| Kzz | Eddy diffusion coefficient | cm−2 s−1 |
| Di | Molecular diffusion coefficient | cm−2 s−1 |
| Hi | =Na kT/μi g, the scale heights of species i | cm |
| Ha |
 , the average scale height | cm |
| Na | Avogadro’s number | molecules mol−1 |
| k | Boltzmann’s constant | erg K−1 |
| R | Gas constant | erg mol−1 K−1 |
| μ | Molar mass, where  is the mean molar mass of the atmosphere, and μi
is the molar mass of species i | g mol−1 |
| Ac | Catalyst surface area per atmospheric column | cm2 catalyst/cm2 Earth |

| Latent heat of H2O condensation | erg g−1 |
| A⊕ | Area of Earth’s surface | cm2 |
| ϕ | Relative humidity | Dimensionless |
| As | Optical surface albedo | Dimensionless |
| p | Atmospheric pressure, where pi is the partial pressure of species i | dynes cm−2 |
| M | Mass of the atmosphere, where Mi is the mass of species i, and Mimp is the mass of an impactor | g |
| g | Gravitational acceleration | cm s−2 |
| αTi | Thermal diffusion coefficient of species i; we neglect this term (αTi = 0) | Dimensionless |
| wi | Fall velocity of a particle | cm s−1 |
| T | Temperature, where Ts is the surface temperature | K |
Download table as: ASCIITypeset image
We can rewrite Equation (B2), replacing ρ Ha using the ideal gas law and the definition of atmospheric scale height,

Here p is the total atmospheric pressure in dynes cm−2, g is the gravitational acceleration in cm s−2, k is the Boltzmann constant,  is the mean molecular weight in g mol−1, and Na
is Avogadro’s number. Therefore,

Next, we must derive an expression for the steam condensation rate ( ) in terms of known variables. Working in cgs units, the total pressure of the atmosphere is given by its gravitational force divided by Earth’s surface area (5.1 × 1018 cm2):

Here M is the mass of the atmosphere in grams. We are considering steam-dominated atmospheres; therefore, the mass and pressure in the above relation are approximately equal to the mass of atmospheric H2O and the H2O partial pressure:


Taking a time derivative of Equation (B8) yields

We assume that the only process changing the H2O mass in the atmosphere is condensation, which occurs in our model when steam becomes saturated. We further assume that the H2O partial pressure is fixed at saturation once steam condensation begins. We approximate the saturation vapor pressure of H2O,  , using the Clausius–Clapeyron equation, assuming a temperature-independent latent heat,
 ,

where p0 and T0 are the reference pressures and temperatures, respectively. Taking a time derivative of Equation (B10) yields

Substituting Equation (B11) into Equation (B9) gives

Finally, we can substitute Equation (B12) into Equation (B5) and rearrange to solve for dT/dt. The result below gives the rate of change of the temperature when the steam is too hot to condense ( ) and when it is condensing (
 ):
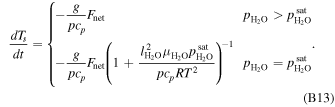
Equations (B1) and (B13) are a system of ordinary differential equations, which we approximately solve over time using the CVODE BDF method developed by Sundials Computing (Hindmarsh et al. 2005). Additionally, for either gas-phase or surface reactions, we make use of the Cantera software library (Goodwin et al. 2022) to compute chemical production and destruction rates. Our code for solving the equations derived in this section (Wogan 2023a) is available at Zenodo at doi:10.5281/zenodo.7802966.
Appendix C: The Photochem Model
To simulate the photochemistry of postimpact reducing atmospheres, we developed a photochemical model called Photochem. The model is a rewritten and vastly updated version of PhotochemPy (Wogan et al. 2022). Photochem is written in modern Fortran and C, with a Python interface made possible by Cython (Behnel et al. 2010). This paper uses Photochem version v0.3.14 (Wogan 2023b), archived in Zenodo at doi:10.5281/zenodo.7802921.
The following sections briefly describe the fundamental model equations solved by Photochem, our chemical network, and validates the model against observations of Earth and Titan.
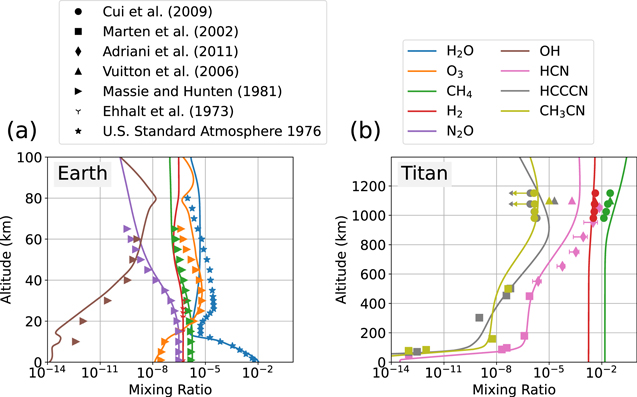
Figure C1. Earth and Titan photochemical model validation. Panels (a) and (b) show the Photochem model applied to Earth and Titan, respectively, compared to data from the literature (Ehhalt et al. 1975; Massie & Hunten 1981; Marten et al. 2002; Vuitton et al. 2006; Cui et al. 2009; Adriani et al. 2011).
Download figure:
Standard image High-resolution image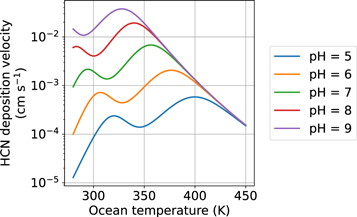
Figure C2. Deposition velocity of HCN caused by hydrolysis in the ocean. The calculations use Equation (C17) assuming vover = 1.2 × 10⁻⁵ cm s−1, zs = 104 cm, and zd = 4 × 105 cm.
Download figure:
Standard image High-resolution imageC.1. Model Equations
We begin our derivation of the equations governing Photochem with modified versions of Equations (B.1), (B.2), and (B.29) in Catling & Kasting (2017):

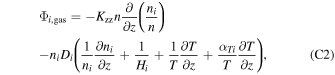

Table B1 explains the variables and their units. Equation (C1) states that molecule concentration (ni
in molecules cm−3) changes over time at a point in space because of vertical movement of particles  and chemical reactions, rainout, or condensation/evaporation (Pi
, Li
, Ri,rainout, and Ci,cond). The equation is 1D because it only considers vertical gas transport and differs from Equation (B.1) in Catling & Kasting (2017) because we explicitly include rainout and condensation. Equation (C2) states that the flux of gases (Φi,gas) is determined by eddy and molecular diffusion, and Equation (C3) assumes that the flux of particles (Φi,particle) is given by eddy diffusion and the rate at which particles fall through the atmosphere.
Many 1D photochemical models further simplify Equation (C1) by assuming that the total number density does not change over time (∂n/∂t ≈ 0). Using this assumption, Equation (C1) is recast in terms of evolving mixing ratios (fi ) rather than number densities (see Appendix B.1 in Catling & Kasting 2017 for a derivation). Such models assume a time-constant temperature profile. The surface pressure is also prescribed, and pressures above the surface are computed with the hydrostatic equation. In order to guarantee that all mixing ratios in the atmosphere sum to 1, the models assume a background filler gas with a mixing ratio fbackground = 1 − ∑i fi . Common choices for the background gas are N2, CO2, or H2, depending on the atmosphere under investigation. By definition, the background gas is not conserved. This approach is valid for steady-state photochemical calculations and also reasonable for atmospheric transitions, which maintain an approximately constant surface pressure and atmospheric temperature. The Photochem code contains an implementation of this traditional approach to photochemical modeling.
Unfortunately, solving a simplified version of Equation (C1) in terms of mixing ratios does not work well for postimpact atmospheric modeling. For example, a postimpact atmosphere can contain 10 bars of H2 that escapes to space over millions of years, lowering the surface pressure to a 1 bar N2-dominated atmosphere (e.g., Figure 6). Traditional photochemical models fail to simulate this scenario because it is not reasonable to assume a single background gas and time-constant surface pressure. Additionally, most models fix the atmospheric temperature during any single model integration, but surface temperature should change significantly as impact-generated H2 escapes to space.
Therefore, Photochem implements a code that solves Equation (C1) in terms of number densities (ni ) without the assumption of fixed surface pressure or a background gas. This approach requires slight modifications to Equations (C2) and (C3), which we describe below. Consider the hydrostatic equation and ideal gas law,


Substituting the ideal gas law into the hydrostatic equation yields


After rearrangement and substituting the definition of scale height,

Now consider the following expansion using the quotient rule:

Substituting Equation (C8) into Equation (C9) and rearrangement gives

Finally, we can substitute Equation (C10) into Equations (C2) and (C3) to derive new equations for the flux of gases and particles:
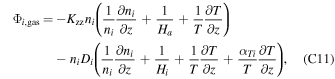

We then apply a finite-volume approximation to the Equation (C1) system of particle differential equations using the fluxes for gases and particles given by Equations (C11) and (C12), which results in a system of ordinary differential equations. We use a second-order centered scheme for all spatial derivatives except falling particles, which use a first-order upwind scheme for stability. Photochem evolves the finite volume approximately forward in time using the CVODE BDF method developed by Sundials Computing (Hindmarsh et al. 2005). The model assumes no background gas, and the surface pressure can evolve over time as, for example, gases escape to space. Additionally, our model computes a self-consistent temperature structure within each time step using the Clima radiative transfer code (Appendix D) assuming a pseudomoist adiabatic troposphere connected to an isothermal upper atmosphere.
An additional challenge of postimpact atmospheres is that the scale height changes by a factor of ∼10 or more when H2 escapes, leaving behind a N2- or CO2-dominated atmosphere (Figure 6). Most relevant photochemistry occurs at pressures >10−7 bar, so we choose a model domain that starts at the surface and extends to an altitude that is approximately this pressure. However, suppose we choose a model domain extending to ∼1000 km (i.e., the 10−7 bar level), appropriate for a H2-dominated atmosphere. After H2 escapes to space, all relevant photochemistry would occur below 100 km, in the bottom several grid cells of the model. Therefore, the important photochemistry would be poorly resolved and inaccurate, and the extremely small pressures at the top of the model domain would likely cause numerical instability. Our solution is to adaptively adjust the model domain so it is always appropriate for atmosphere scale height. We use the rootfinding functionally in CVODE to halt integration whenever the pressure at the top of the atmosphere falls below 10−7 bars and lower the top of the model domain before continuing integration. This procedure is automatically done tens to hundreds of times during each postimpact integration.
C.2. Chemical Network, Photolysis Cross Sections, and Thermodynamic Data
Our chemical reactions, photolysis cross sections, and thermodynamic data used for all gas-phase kinetics are archived in a Zenodo repository at doi:10.5281/zenodo.7802962. Chemical reactions and thermodynamic data are in the file “reaction_mechanisms/zahnle_earth.yaml,” and photolysis cross sections are in the folder “xsections/.” All thermodynamic data are from the NIST Chemistry WebBook (Linstrom & Mallard 1998). The chemical and photolysis reactions are an updated version of rates presented in Zahnle et al. (2016).
In this paper, our model simulates rainout in droplets of water for the following species: particles, OH, CN, HCN, C2H4, NO, HO2, N2O, H2O2, O3, NO2, NO3, HNO2, HNO3, C2H6, CH3OH, CH3CHO, C3H6, and CH3CN.
C.3. Model Validation
Figure C1 shows Photochem applied to Earth and Titan compared to observations gathered from the literature. All boundary conditions and settings for each model are archived in the “ModernEarth” and “Titan” templates in Zenodo at doi:10.5281/zenodo.7802921. Our model of Titan fixes the surface CH4 mixing ratio to a 0.015 volume mixing ratio, permits H2 escape at the diffusion-limited rate, and allows aerosols to fall to Titan’s surface but otherwise has zero-flux boundary conditions. We ignore the effects of galactic cosmic rays, which causes our model to underpredict the nitrile haze production in the lower atmosphere (Lavvas et al. 2008b). Additionally, we neglect ion chemistry, which is argued to be important for the formation of large hydrocarbons (e.g., C6H6) but inconsequential for smaller molecular weight species. Despite these omissions, Photochem broadly reproduces the main cyanide chemistry on Titan.
C.4. Deposition Velocity of HCN
Our photochemical-climate simulations of a postimpact atmosphere assume a HCN surface deposition velocity of 7 × 10⁻³ cm s−1. Here we describe a simple model of HCN hydrolysis in the ocean that justifies this value.
Motivated by Appendix 3 in Kharecha et al. (2005), we imagine a two-box ocean model with a surface ocean of depth ∼100 m and a deep ocean (∼4 km). We assume that HCN transport into the ocean is governed by a stagnant boundary layer model (see Figure 3 in Kharecha et al. 2005), where it is destroyed by hydrolysis reactions. The HCN is mixed between the surface and deep ocean reservoirs by a turnover velocity, vover, which we nominally take to be 1.2 × 10⁻⁵ cm s−1, which is appropriate for modern Earth. Under these circumstances, the following system of ordinary differential equations governs the concentration of HCN in the surface and deep ocean:
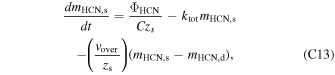

Here  and
 are the concentration of HCN in the surface and deep ocean, respectively, in mol L−1; C is a constant equal to 6.022 × 10²⁰ molecules mol−1 L cm−3; zs is the depth of the surface ocean; and zd is the depth of the deep ocean. We compute the temperature and pH-dependent hydrolysis rate coefficient, ktot, following Miyakawa et al. (2002). Here
 is the HCN flux into the ocean in molecules cm−2 s−1, which is determined by a stagnant boundary layer model:

We assume that the piston velocity of HCN is 5 × 10⁻³ cm s−1, which is the same as the piston velocity of CO (Kharecha et al. 2005, Table 1). Also,  is the Henry’s law coefficient for HCN. The flux of a gas can also be parameterized with a deposition velocity (
 ):

Assuming a steady state ( ) and solving for
 in Equations (C13)–(C16) yields
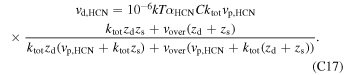
Here we assume that the temperature and pH of the ocean are uniform and that the temperature of the surface air is the same as the temperature of the ocean.
Figure C2 computes the deposition velocity of HCN using Equation (C17) over a wide range of ocean temperatures and pH. Kadoya et al. (2020) used a model of the geologic carbon cycle to argue that the Hadean ocean was moderately alkaline (pH ≈ 8). Therefore, we choose a HCN deposition velocity of 7 × 10⁻³ cm s−1 for our nominal model because it is a reasonable approximation of the pH = 8 case over a wide range of temperatures. Additionally, we assume that HCCCN has the same deposition velocity as HCN, also caused by hydrolysis reactions in the ocean.
We have rerun our photochemical-climate simulations of postimpact atmospheres with order-of-magnitude larger and smaller HCN deposition velocities. The results are qualitatively unchanged. For example, assuming  cm s−1 for a 2 × 10²¹ kg impactor in Figure 7 causes 1 order of magnitude smaller HCN ocean deposition. However, the HCN rainout and surface pressure are unchanged because HCN rainout dominates over the HCN ocean deposition.
Appendix D: The Clima Radiative Transfer and Climate Model
To simulate the climate of postimpact atmospheres, we developed a new radiative transfer and climate code called Clima. We approximately solve the radiative transfer equation using standard two-stream methods (Toon et al. 1989). The code includes opacities representing photolysis, Rayleigh scattering, and CIA and approximates line absorption with k-distributions. All available opacities and citations, except photolysis cross sections, are listed in Table D1. In this paper, to account for line absorption of multiple species, we use the “random overlap with resorting and rebinning” method described in Amundsen et al. (2017).
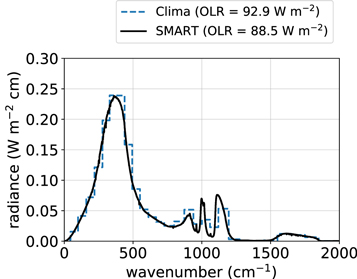
Figure D1. Outgoing longwave radiation of a 2 bar CO2 atmosphere on Mars with a 250 K surface temperature, computed with Clima (this work) and SMART (Meadows & Crisp 1996). The agreement between the two codes validates Clima.
Download figure:
Standard image High-resolution imageTable D1. Opacities Used in the Clima Radiative Transfer Code
| Opacity Type | Opacity | Notes | Citation |
|---|---|---|---|
| k-distributions a | H2O | HITEMP2010 for 0–30,000 cm−1 and HITRAN2016 for 30,000–42,000 cm−1. Voigt line shape with 25 cm−1 cutoff. Assumes Earth air broadening coefficients. Plinth or base is removed because this opacity is combined with MT_CKD H2O continuum. | Rothman et al. (2010); Gordon et al. (2017) |
| CO2 | HITEMP2010. Sub-Lorentzian line shape with 500 cm−1 cutoff. Assumes self-broadening coefficients. | Rothman et al. (2010) | |
| CH4 | HITEMP2020. Voigt line shape with 25 cm−1 cutoff. Assumes Earth air broadening coefficients. | Hargreaves et al. (2020) | |
| CO | HITEMP2019. Voigt line shape with 25 cm−1 cutoff. Assumes self-broadening coefficients. | Li et al. (2015) | |
| O2 | HITRAN2016. Voigt line shape with 25 cm−1 cutoff. Assumes Earth air broadening coefficients. | Gordon et al. (2017) | |
| O3 | HITRAN2016. Voigt line shape with 25 cm−1 cutoff. Assumes Earth air broadening coefficients. | Gordon et al. (2017) | |
| NH3 | HITRAN2016. Voigt line shape with 25 cm−1 cutoff. Assumes Earth air broadening coefficients. | Gordon et al. (2017) | |
| CIA | H2–H2 | ⋯ | Mollière et al. (2019) |
| H2–He | ⋯ | Mollière et al. (2019) | |
| N2–N2 | ⋯ | Mollière et al. (2019) | |
| CH4–CH4 | ⋯ | Karman et al. (2019) | |
| N2–O2 | ⋯ | Karman et al. (2019) | |
| O2–O2 | ⋯ | Karman et al. (2019) | |
| H2–CH4 | ⋯ | Karman et al. (2019) | |
| CO2–CO2 | ⋯ | Karman et al. (2019) | |
| CO2–CH4 | ⋯ | Karman et al. (2019) | |
| CO2–N2 | ⋯ | Karman et al. (2019) | |
| N2–H2 | ⋯ | Karman et al. (2019) | |
| Rayleigh scattering b | N2 | ⋯ | Penndorf (1957); Keady & Kilcrease (2002) |
| CO2 | ⋯ | Shemansky (1972); Keady & Kilcrease (2002) | |
| O2 | ⋯ | Penndorf (1957); Keady & Kilcrease (2002) | |
| H2O | ⋯ | Murphy (1977); Keady & Kilcrease (2002); Ranjan & Sasselov (2017) | |
| H2 | ⋯ | Keady & Kilcrease (2002) | |
Notes.
a All k-distributions are computed using HELIOS-K (Grimm et al. 2021). b Rayleigh scattering opacities are computed using a parameterization from Vardavas & Carver (1984).Download table as: ASCIITypeset image
Figure D1 shows a thermal emission spectra computed with Clima for a 2 bar pure CO2 atmosphere on Mars with a 250 K surface temperature. This same benchmark has been computed by several other radiative transfer codes: SOCRATES (Wolf et al. 2022, Figure 2), ExoRT (Wolf et al. 2022, Figure 2), SMART (Figure D1), and the radiative transfer code used in Kopparapu et al. (2013, Figure 1). All codes estimate the total outgoing thermal energy to be between 86 and 94 W m−2, which is comparable to the value computed by Clima (92.9 W m−2).
The Clima code also includes an adiabatic climate model, which we use in Section 4.4.2. Given partial pressures of gases at the surface, the code draws a pseudoadiabat temperature profile upward using Equation (1) in Graham et al. (2021) until the temperature reaches an assumed isothermal stratosphere. The code is general and can consider any number of condensing species, but H2O is the only relevant condensable for postimpact atmospheres. Finally, to find an equilibrium climate, we solve a nonlinear equation for the surface temperature that balances incoming solar and outgoing longwave radiation. Each iteration of the nonlinear solve involves drawing an adiabat upward and then computing the solar and infrared radiative fluxes.
We have validated the stand-alone climate model in Clima by reproducing the calculations in Wordsworth et al. (2017) of early Mars with CO2 and H2 atmospheres (left panel of Figure 2 in Wordsworth et al. 2017). Furthermore, we predict the runaway greenhouse limit to be 291 W m−2, which is in acceptable agreement with the literature (e.g., Kopparapu et al. 2013). Finally, we have also confirmed that our code for drawing pseudomoist adiabats reproduces the code used in Graham et al. (2021).
The version of Clima used in this paper (v0.3.7; Wogan 2023c) is archived on Zenodo (10.5281/zenodo.8060772), while the most up-to-date version can be found on GitHub (https://github.com/Nicholaswogan/clima).
Footnotes
- 5
The FMQ is the fayalite–magnetite–quartz redox buffer. See Chapter 7 in Catling & Kasting (2017) for a discussion of redox buffers.
- 6
Partial pressures depend on the mean molecular weight of the atmosphere. The 1022 kg simulation in Figure 4 has 65.0 bars of H2 before the ocean vapor condenses and would have 23.8 bars of H2 if there was no water vapor in the atmosphere. Both scenarios have the same number of H2 molecules in the atmosphere but different partial pressures because of dissimilar mean molecular weights. To avoid ambiguity, we occasionally report partial pressures in “dry” bars, which is the partial pressure of a gas if the atmosphere had no water vapor.


