


Linux 存在众多 tracing tools,比如 ftrace、perf,他们可用于内核的调试、提高内核的可观测性。众多的工具也意味着繁杂的概念,诸如 tracepoint、trace events、kprobe、eBPF 等,甚至让人搞不清楚他们到底是干什么的。本文尝试理清这些概念。
注入 Probe 的机制
Probe Handler
如果我们想要追踪内核的一个函数或者某一行代码,查看执行的上下文和执行情况,通用的做法是在代码或函数的执行前后 printk 打印日志,然后通过日志来查看追踪信息。但是这种方式需要重新编译内核并重启,非常麻烦。如果是在生产环境排查问题,这种方式也是无法接受的。
一种比较合理的方式是在内核正常运行时,自定义一个函数,注入到我们想要追踪的内核函数执行前后,当内核函数执行时触发我们定义的函数,我们在函数中实现获取我们想要的上下文信息并保存下来。同时因为增加了内核函数的执行流程,我们定义的函数最好是需要的时候开启,不需要的时候关闭,避免对内核函数造成影响。
这个自定义的函数就是 probe handler,注入 probe handler 的地方被称为探测点或者 Hook 点,在探测点前执行的 probe handler 叫 pre handler, 执行后的叫 post handler,注入 probe handler 的方式被称为“插桩”,内核提供了多种 probe handler 注入机制。接下来我们聊一聊他们是如何实现在内核运行时注入 probe handler。
Kprobes 机制
Kprobes 是一个动态 tracing 机制,能够动态的注入到内核的任意函数中的任意地方,采集调试信息和性能信息,并且不影响内核的运行。Kprobes 有两种类型:kprobes、kretprobes。kprobes 用于在内核函数的任意位置注入 probe handler,kretprobes 用于在函数返回位置注入 probe handler。出于安全性考虑,在内核代码中,并非所有的函数都能“插桩”,kprobe 维护了一个黑名单记录了不允许插桩的的函数,比如 kprobe 自身,防止递归调用。
kprobes 机制如何实现注入 probe handler
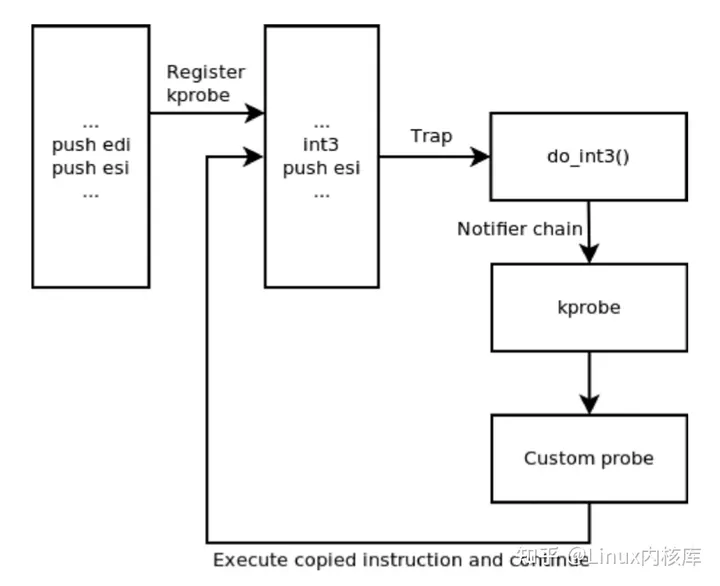
内核提供了一个 krpobe 注册接口,当我们调用接口注册一个 kprobe 在指定探测点注入 probe handler 时,内核会把探测点对应的指令复制一份,记录下来,并且把探测点的指令的首字节替换为「断点」指令,在 x86 平台上也就是 int3 指令。
cpu 执行断点指令时,会触发内核的断点处理函数「do_int3」,它判断是否为 kprobe 引起的断点,如果是 kprobe 机制触发的断点,会保存这个程序的状态,比如寄存器、堆栈等信息,并通过 Linux 的「notifier_call_chain」机制,将 cpu 的使用权交给之前 kprobe 的 probe handler,同时会把内核所保存的寄存器、堆栈信息传递给 probe handler。
前面已经提到了,probe handler 分两种类型,一种是 pre handler、一种是 post handler。pre handler 将首先被调用(如果有的话),pre handler 执行完成后,内核会将 cpu 的 flag 寄存器的值设置为 1,开始单步执行原指令,单步执行是 cpu 的一个 debug 特性,当 cpu 执行完一个指令后便会产生一个 int1 异常,触发中断处理函数「do_debug」执行,do_debug 函数会检查本次中断是否为 kprobe 引起,如果是的话,执行 post handler,执行完毕后关闭单步,恢复原始执行流。
kretprobe 探针很有意思,Kprobe 会在函数的入口处注册一个 kprobe,当函数执行时,这个 krpobe 会把函数的返回地址暂存下来,并把它替换为 trampoline 地址。
Kprobe 也会在 trampoline 注册一个 kprobe,函数执行返回时,cpu 控制权转移到 trampoline,此时又会触发 trampoline 上的 kprobe 探针,继续陷入中断,并执行 probe handler。
为什么有了 kprobe 还需要 kretprobe?
Kprobe 在可以函数的任意位置插入 probe,理论上他也能实现 kretprobe 的功能,但是实际上会面临几个挑战。
比如当我们在函数的最后一行代码上注入探针,试图使用 kprobe 实现 kretprobe 的效果,但是实际上这种方式并不好,函数可能会存在多个返回情况,比如不满足 if 条件,发生异常等情况,此时代码完全有可能不会执行最后一行代码,而是在某个地方就返回了,也就意味着不会触发探针执行。
kretprobe 的优势就在于它可以稳定的在函数返回时触发 probe handler 执行,无论函数是基于什么情况下返回。
另外一方面 kprobe 虽然可以在函数的任意位置插入探针,但是实际情况下都是在函数入口处插入探针,因为函数入口是有一条标准的指令序列 prologue 可以进行断点替换,而函数内部的其他位置,可能会存在跳转指令、循环指令等情况,指令序列不太规则,不方便做断点替换。
Uprobes
Uprobes 也分为 uprobes 和 uretprobes,和 Kprobes 从原理上来说基本上是类似的,通过断点指令替换原指令实现注入 probe handler 的能力,并且他没有 Kprobes 的黑名单限制。Uprobes 需要我们提供「探测点的偏移量」,探测点的偏移量是指从程序的起始虚拟内存地址到探测点指令的偏移量。我们可以通过一个简单的例子来理解:
root@zfane-maxpower:~/traceing# cat hello.c
#include <stdio.h>
void test(){
printf("hello world");
}
int main() {
    test();
return 0;
}
root@zfane-maxpower:~/traceing# gcc hello.c -o hello
通过 readelf 读取程序的 ELF 信息,拿到程序的符号表、节表。符号表包含程序中所有的符号,例如全局变量、局部变量、函数、动态链接库符号,以及符号对应的虚拟内存地址。
汇编语言是按照节来编写程序的,例如.text 节、.data 节。每个节都包含程序中的特定数据或代码,节表就是程序中各个节的信息表。
通过符号表可以拿到 hello 函数的虚拟内存地址,通过节表拿到.text 节的虚拟内存地址,以及.text 节相较于 ELF 起始地址的偏移量。
root@zfane-maxpower:~/traceing# readelf -s hello|grep test
36: 0000000000001149    31 FUNC    GLOBAL DEFAULT   16 test
root@zfane-maxpower:~/traceing# readelf -S hello|grep .text
  [16] .text             PROGBITS         0000000000001060  00001060
那么 test 函数的指令在 hello 二进制文件的偏移量就可以计算出来了。
offset=test 函数的虚拟地址 -  .text 段的虚拟地址 + .text 端偏移量
offset= 0000000000001149 - 0000000000001060 + 00001060
offset= 0000000000001149
现在我们可以通过编写内核模块向二进制程序注入 probe handler 获取数据了。
#include <linux/kernel.h>
#include <linux/init.h>
#include <linux/module.h>
#include <linux/fs.h>
#include <linux/uprobes.h>
#include <linux/namei.h>
#include <linux/string.h>
#include <linux/uaccess.h>

#define DEBUGGEE_FILE "/home/zfane/hello/hello"
#define DEBUGGEE_FILE_OFFSET (0x1149)
static struct inode *debuggee_inode;

static int uprobe_sample_handler(struct uprobe_consumer *con,
                                 struct pt_regs *regs)
{
    printk("handler is executed, arg0: %s\\n",regs->di);

return 0;
}

static int uprobe_sample_ret_handler(struct uprobe_consumer *con,
unsigned long func,
                                     struct pt_regs *regs)
{
    printk("ret_handler is executed\\n");
return 0;
}

static struct uprobe_consumer uc = {
        .handler = uprobe_sample_handler,
        .ret_handler = uprobe_sample_ret_handler
};

static int __init init_uprobe_sample(void)
{
int ret;
struct path path;

    ret = kern_path(DEBUGGEE_FILE, LOOKUP_FOLLOW, &path);
if (ret) {
return -1;
    }

    debuggee_inode = igrab(path.dentry->d_inode);
    path_put(&path);

    ret = uprobe_register(debuggee_inode,
                          DEBUGGEE_FILE_OFFSET, &uc);
if (ret < 0) {
return -1;
    }

    printk(KERN_INFO "insmod uprobe_sample\\n");
return 0;
}

static void __exit exit_uprobe_sample(void)
{
    uprobe_unregister(debuggee_inode,
                      DEBUGGEE_FILE_OFFSET, &uc);
    printk(KERN_INFO "rmmod uprobe_sample\\n");
}

module_init(init_uprobe_sample);
module_exit(exit_uprobe_sample);

MODULE_LICENSE("GPL");
Tracepoint
Tracepoint 是一个静态的 tracing 机制,开发者在内核的代码里的固定位置声明了一些 Hook 点,通过这些 hook 点实现相应的追踪代码插入,一个 Hook 点被称为一个 tracepoint。
tracepoint 有开启和关闭两种状态,默认处于关闭状态,对内核产生的影响非常小,只是增加了极少的时间开销(一个分支条件判断),极小的空间开销(一条函数调用语句和几个数据结构)。
在 x86 环境下,内核代码编译后,关闭状态的 tracepoint 代码对应的 cpu 指令是:nop 指令,
启用 tracepoint 时,通过 Linux 内核提供的 static jump patch 静态跳转补丁机制,nop 指令会被替换为 jmp 指令,jmp 指令将 cpu 的使用权转移给 static_call 静态跳转函数,这个函数会遍历 tracepoint probe handler 数组获取当前 tracepoint 注册的 probe handler,并进一步跳转到 probe handler 执行,probe handler 执行完成后,再通过 jmp 指令跳转回原函数继续执行。
#include <linux/module.h>
#include <linux/ftrace.h>
#include <linux/tracepoint.h>
#include <linux/proc_fs.h>
#include <linux/seq_file.h>
#include <linux/hashtable.h>
#include <linux/slab.h>
#include <linux/time.h>
#include <linux/percpu.h>
#include <trace/events/sched.h>

static void probe_sched_switch(void *ignore, bool preempt,
                               struct task_struct *prev, struct task_struct *next,
unsigned int prev_state) {
    pr_info("probe_sched_switch: pid [%d] -> [%d] \\n",prev->tgid, next->tgid);
}

struct tracepoints_table {
const char *name;
void *fct;
struct tracepoint *value;
char init;
};

struct tracepoints_table interests[] = {

  {.name = "sched_switch", .fct = probe_sched_switch}};

#define FOR_EACH_INTEREST(i) \\
    for (i = 0; i < sizeof(interests) / sizeof(struct tracepoints_table); i++)

static void lookup_tracepoints(struct tracepoint *tp, void *ignore) {
int i;
    FOR_EACH_INTEREST(i) {
if (strcmp(interests[i].name, tp->name) == 0) interests[i].value = tp;
    }
}

static void cleanup(void) {
int i;

// Cleanup the tracepoints
    FOR_EACH_INTEREST(i) {
if (interests[i].init) {
            tracepoint_probe_unregister(interests[i].value, interests[i].fct,NULL);
        }
    }
}

static void __exit tracepoint_exit(void) { cleanup(); }

static int __init tracepoint_init(void)
{
int i;
// Install the tracepoints
    for_each_kernel_tracepoint(lookup_tracepoints, NULL);
    FOR_EACH_INTEREST(i) {
if (interests[i].value == NULL) {
            printk("Error, %s not found\\n", interests[i].name);
            cleanup();
return 1;
        }

        tracepoint_probe_register(interests[i].value, interests[i].fct, NULL);
        interests[i].init = 1;
    }

return 0;
}

module_init(tracepoint_init)
module_exit(tracepoint_exit)
MODULE_
 75
75


 扫一扫
扫一扫


 被折叠的 条评论
为什么被折叠?
被折叠的 条评论
为什么被折叠?
 到【灌水乐园】发言


