


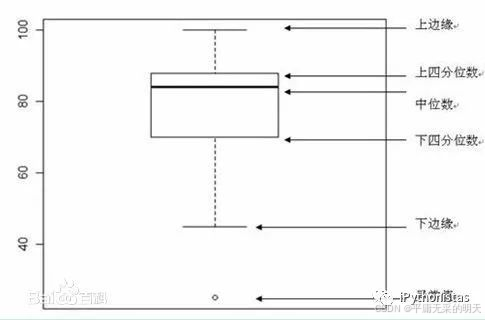
箱形图(Box-plot)又称为盒须图、盒式图或箱线图,是一种用作显示一组数据分散情况资料的统计图。它能显示出一组数据的最大值、最小值、中位数及上下四分位数。因形状如箱子而得名。在各种领域也经常被使用,常见于品质管理。
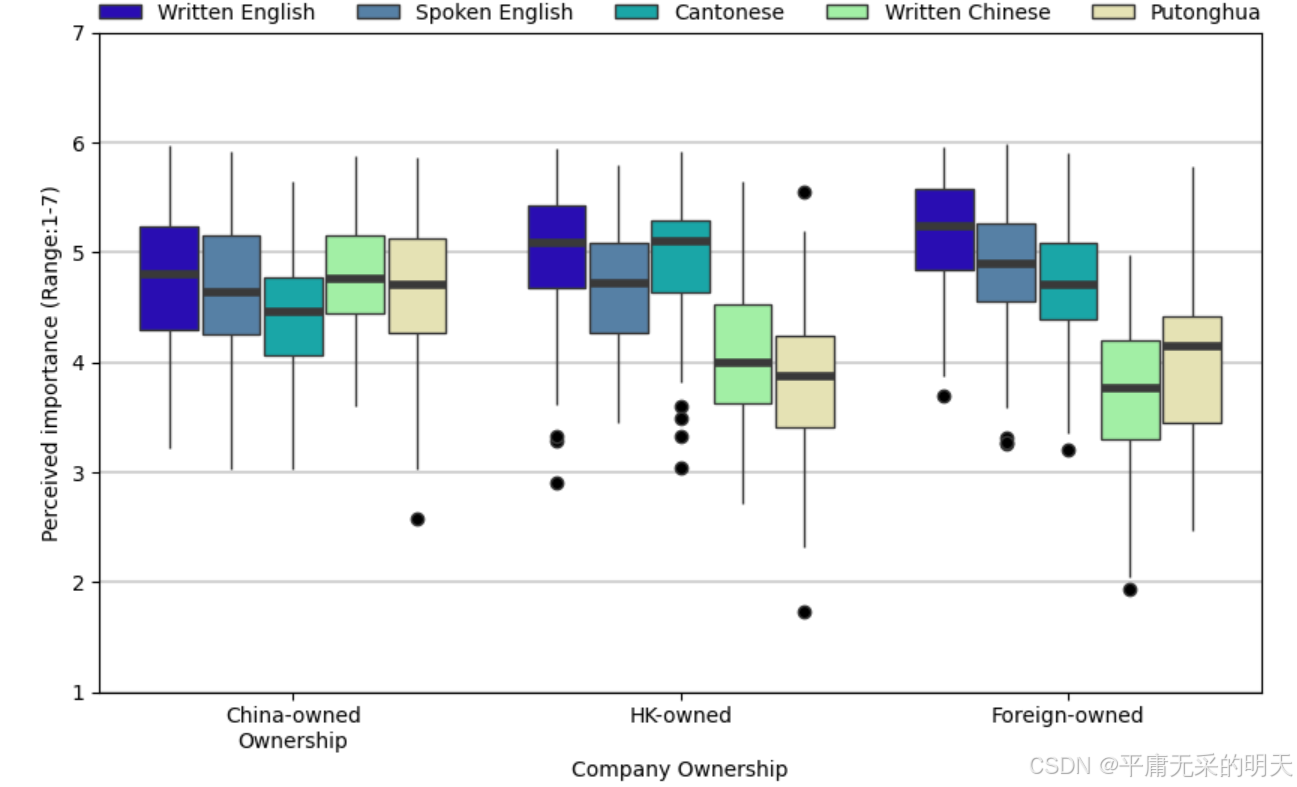
中位数变粗: medianprops={'linewidth': 4}
箱型宽度: widths=0.15
上下边缘隐藏: showcaps=False
白点变黑点: flierprops={'marker': 'o', 'markerfacecolor': 'black'}
import pandas as pd
import matplotlib.pyplot as plt
import seaborn as sns
df = pd.read_csv(r'/content/sample_data/Example_Distributions.csv')
plt.figure(figsize=(10, 5))
s = "China-owned\r\nOwnership"
new = s.replace("\r\n","\n")
df['group'] = df['group'].replace('China-owned\r\nOwnership', 'China-owned\nOwnership')
new_order=[new,'HK-owned', 'Foreign-owned']
colors = {
'Written English': 'mediumblue',
'Spoken English': 'c',
'Cantonese': 'steelblue',
'Written Chinese': 'palegreen',
'Putonghua': 'palegoldenrod'}
palette = {key: value for key, value in zip(df['class'].unique(), colors.values())}
sns.boxplot(x='group', y='value',order=new_order, hue='class',hue_order=['Written English', 'Spoken English', 'Cantonese','Written Chinese', 'Putonghua'],
zorder=1, data=df, palette=palette, medianprops={'linewidth': 4}, flierprops={'marker': 'o', 'markerfacecolor': 'black'}, widths=0.15, showcaps=False)
plt.xlabel('Company Ownership')
plt.ylabel('Perceived importance (Range:1-7)')
plt.ylim(1, 7)
plt.axhline(y=1, color='lightgrey', zorder=0)
plt.axhline(y=2, color='lightgrey', zorder=0)
plt.axhline(y=3, color='lightgrey', zorder=0)
plt.axhline(y=4, color='lightgrey', zorder=0)
plt.axhline(y=5, color='lightgrey', zorder=0)
plt.axhline(y=6, color='lightgrey', zorder=0)
plt.axhline(y=7, color='lightgrey', zorder=0)
plt.legend(title='Class')
plt.legend(loc='center', bbox_to_anchor=(0.5, 1.03), ncol=5, frameon=False)
plt.subplots_adjust(bottom=0)
plt.show()


 扫一扫
扫一扫


 8640
8640

 被折叠的 条评论
为什么被折叠?
被折叠的 条评论
为什么被折叠?
 到【灌水乐园】发言


