



APACHE POI导出应用 – 导出PPT表格+ JFreeChart图表图片(柱状图图片)
文章目录
前言
本文将详细阐述如何运用 Apache POI 4.1.2 和 Spring Boot 技术实现导出 PPT 表格+ JFreeChart图表图片的功能 ,为开发者提供清晰的技术指引与实践参考。
一、准备工作
引入库
<dependency>
     <groupId>org.apache.poi</groupId>
      <artifactId>poi-ooxml</artifactId>
      <version>4.1.2</version>
  </dependency>
  <dependency>
      <groupId>org.apache.poi</groupId>
      <artifactId>poi-ooxml-schemas</artifactId>
      <version>4.1.2</version>
  </dependency>
  <dependency>
      <groupId>org.apache.xmlbeans</groupId>
      <artifactId>xmlbeans</artifactId>
      <version>3.1.0</version>
  </dependency>
   <!-- JFreeChart -->
   <dependency>
       <groupId>org.jfree</groupId>
       <artifactId>jfreechart</artifactId>
       <version>1.5.3</version>
   </dependency>
   <dependency>
       <groupId>org.jfree</groupId>
       <artifactId>jcommon</artifactId>
       <version>1.0.24</version>
   </dependency>
二、代码编写(仅参考)
1.代码实体、controller、service层
HouseMortgageLedge
// 提供查询条件 例如时间查询、类型查询等字段

// controller
 @RequestMapping(value = "/exportWeek")
 public void exportWeek(HttpServletRequest request, HttpServletResponse response, HouseMortgageLedge houseMortgageLedge) {
	 houseMortgageLedgeService.exportWeek(houseMortgageLedge, request, response);
 }
// service
void exportWeek(HouseMortgageLedge houseMortgageLedge, HttpServletRequest request, HttpServletResponse response);
2.逻辑代码
代码如下(示例):
service.impl
@Override
    public void exportWeek(HouseMortgageLedge houseMortgageLedge, HttpServletRequest request, HttpServletResponse response) {
        // ppt导出
        try {
            // 模板文件位置
            String templateFolder = upLoadPath + File.separator + TEMPLE_URL + File.separator +  "houseLedger";
            String templateName = "exportWeek.pptx";
            // 检查模板文件是否存在
            FileUtils.checkFile(templateFolder, templateName);
            // 加载 PPT 模板
            XMLSlideShow ppt = new XMLSlideShow(new FileInputStream(templateFolder + File.separator + templateName));
            // 获取第一张幻灯片
           // XSLFSlide slide = ppt.getSlides().get(0);
           // WeekHelper.setPianOne(slide, houseMortgageLedge);
            // todo 后续添加其他幻灯片逻辑
            // 获取第二张幻灯片
            XSLFSlide slide2 = ppt.getSlides().get(1);
            WeekHelper.setPianTwo(slide2, houseMortgageLedge);

            FileUtils.close(response, ppt);
        } catch (UnsupportedEncodingException e) {
            e.printStackTrace();
        } catch (IOException e) {
            e.printStackTrace();
        } catch (Exception e) {
            e.printStackTrace();
        }
    }
工具方法
FileUtils 文件操作工具类
	@Slf4j
public class FileUtils {

    /**
     * @Title checkFile
     * @Description  检查文件是否存在,不存在则抛出异常
     * @param templateFolder
     * @param templateName
     * @return void
    */
    public static void checkFile(String templateFolder, String templateName){
        String templatePath = templateFolder + File.separator + templateName;
        File folder = new File(templateFolder);
        // 文件夹不存在则创建文件夹
        if(!folder.exists()){
            folder.mkdirs();
        }
        // 文件不存在 则联系管理员添加导出模板
        File file = new File(templatePath);
        if(!file.exists()){
            throw new JeecgBootException("导出模板不存在,请联系管理员在【" + templatePath + "】路径添加导出模板!");
        }
    }

    /**
     * @Title close
     * @Description 关闭资源,并导出ppt文件
     * @param response
     * @param ppt
     * @return void
    */
    public static void close(HttpServletResponse response, XMLSlideShow ppt) throws IOException {
        String fileName = "output.pptx";
        response.addHeader("filename", URLEncoder.encode(fileName,"utf-8"));
        response.addHeader("Access-Control-Expose-Headers","filename");
        response.setContentType("application/vnd.openxmlformats-officedocument.presentationml.presentation");
        response.setHeader("Content-Disposition", "attachment; fileName=" + URLEncoder.encode(fileName, "utf-8"));
        OutputStream out = response.getOutputStream();
        ppt.write(out);
        out.flush();
    }
}
WeekHelper 导出帮助类
	@Slf4j
public class WeekHelper {

    // 设置颜色值
    private static final String BACKGROUND_COLOR = "#E5F6FF";

  /**
     * @Title setPianTwo
     * @Description 设置第二张幻灯片数据
     * @param slide
     * @param houseMortgageLedge
     * @return void
    */
    public static void setPianTwo(XSLFSlide slide, HouseMortgageLedge houseMortgageLedge) throws Exception {
        // todo 填充其他信息
        // 查找表格占位符
        XSLFTable placeholderTable = null;
        for (XSLFShape shape : slide.getShapes()) {
            if (shape instanceof XSLFTable) {
                placeholderTable = (XSLFTable) shape;
                break;
            }
        }
        if (placeholderTable != null) {
            // 清空占位符表格中的原有内容
            while (placeholderTable.getNumberOfRows() > 0) {
                placeholderTable.removeRow(0);
            }
            // 添加表头 todo 这里自定义表头
            PPTUtils.setTableHeader(placeholderTable, Arrays.asList("单位名称", "累计网签完成情况", "网签额", "本周网签额"));
            // 填充表格数据
            // 模拟要导出的表格数据 todo 这里需改正为真实的表格数据,此处仅为模拟数据
            List<Map<String, Object>> dataList = PPTUtils.simulateList();
            DecimalFormat df = new DecimalFormat("#,##0.00");
            for (Map<String, Object> rowData : dataList) {
                XSLFTableRow row = placeholderTable.addRow();
                row.setHeight(20.0);

                XSLFTableCell cell1 = row.addCell();
                PPTUtils.setCellStyle(cell1, rowData.get("companyName").toString(), Color.decode(BACKGROUND_COLOR), false);

                XSLFTableCell cell4 = row.addCell();
                PPTUtils.setCellStyle(cell4, df.format(rowData.get("totalComplate")), Color.decode(BACKGROUND_COLOR), false, true);

                XSLFTableCell cell5 = row.addCell();
                PPTUtils.setCellStyle(cell5, df.format(rowData.get("wqe")), Color.decode(BACKGROUND_COLOR), false, true);

                XSLFTableCell cell6 = row.addCell();
                PPTUtils.setCellStyle(cell6, df.format(rowData.get("currentWeekWqe")), Color.decode(BACKGROUND_COLOR), false, true);
            }
            // todo 添加总计数据
            XSLFTableRow row = placeholderTable.addRow();
            row.setHeight(20.0);

            XSLFTableCell totalCell = row.addCell();
            PPTUtils.setCellStyle(totalCell, "合计", Color.decode(BACKGROUND_COLOR), true);

            XSLFTableCell cell2 = row.addCell();
            PPTUtils.setCellStyle(cell2, df.format(0), Color.decode(BACKGROUND_COLOR), false, true);

            XSLFTableCell cell3 = row.addCell();
            PPTUtils.setCellStyle(cell3, df.format(0), Color.decode(BACKGROUND_COLOR), false, true);

            XSLFTableCell cell4 = row.addCell();
            PPTUtils.setCellStyle(cell4, df.format(0), Color.decode(BACKGROUND_COLOR), false, true);

            // 设置表格的样式
            PPTUtils.setTableStyle(placeholderTable);

            // JFreeChart方式 -- 生成图表并直接插入
            // Apache POI 在处理 PowerPoint 时,无法直接将 JFreeChart 生成的图表对象嵌入为可编辑的 PPT 图表元素。目前主流做法是将图表保存为图片(如 PNG、JPEG),再将图片插入 PPT 中
            JFreeChart chart = JFreeChartCreate.createChartWeekTwo(dataList);
//             采用内存操作,无需临时文件,直接以流的方式插入到幻灯片中
            PPTUtils.insertChartToSlide(slide, chart, 530, 400, 401, 124);
        }
    }

 }
PPTUtils PPT操作工具类
	@Slf4j
public class PPTUtils {

    private static final String HEADER_COLOR = "#D9E1F4";


    public static List<Map<String, Object>> simulateList(){
        List<Map<String, Object>> list = Lists.newArrayList();
        Map<String, Object> map1 = Maps.newHashMap();
        map1.put("companyName", "第一分公司");
        map1.put("target", 324130122.63);
        map1.put("complateRate", 80);
        map1.put("totalComplate", 260104098.10);
        map1.put("wqe", 260104098.10);
        map1.put("currentWeekWqe", 260104098.10);
        map1.put("currentMonthWqe", 260104098.10);

        Map<String, Object> map2 = Maps.newHashMap();
        map2.put("companyName", "第二分公司");
        map2.put("target", 454130122.63);
        map2.put("complateRate", 67.54);
        map2.put("totalComplate", 4445333.55);
        map2.put("wqe", 260104098.10);
        map2.put("currentWeekWqe", 260104098.10);
        map2.put("currentMonthWqe", 260104098.10);

        Map<String, Object> map3 = Maps.newHashMap();
        map3.put("companyName", "济南分公司");
        map3.put("target", 454130122.63);
        map3.put("complateRate", 67.54);
        map3.put("totalComplate", 4424433.55);
        map3.put("wqe", 260104098.10);
        map3.put("currentWeekWqe", 260104098.10);
        map3.put("currentMonthWqe", 260104098.10);

        Map<String, Object> map4 = Maps.newHashMap();
        map4.put("companyName", "青岛分公司");
        map4.put("target", 454130122.63);
        map4.put("complateRate", 67.54);
        map4.put("totalComplate", 35677744.55);
        map4.put("wqe", 260104098.10);
        map4.put("currentWeekWqe", 260104098.10);
        map4.put("currentMonthWqe", 260104098.10);

        list.add(map1);
        list.add(map2);
        list.add(map3);
        list.add(map4);
        return list;
    }

    /**
     * @Title setTableStyle
     * @Description 设置表格的样式
     * @param placeholderTable
     * @return void
    */
    public static void setTableStyle(XSLFTable placeholderTable){
        // 设置表格边框
        for (XSLFTableRow row : placeholderTable.getRows()) {
            for (XSLFTableCell cell : row.getCells()) {
                cell.setBorderColor(TableCell.BorderEdge.left, Color.BLACK);
                cell.setBorderColor(TableCell.BorderEdge.right, Color.BLACK);
                cell.setBorderColor(TableCell.BorderEdge.top, Color.BLACK);
                cell.setBorderColor(TableCell.BorderEdge.bottom, Color.BLACK);
                cell.setBorderWidth(TableCell.BorderEdge.left, 1);
                cell.setBorderWidth(TableCell.BorderEdge.right, 1);
                cell.setBorderWidth(TableCell.BorderEdge.top, 1);
                cell.setBorderWidth(TableCell.BorderEdge.bottom, 1);
                for (XSLFTextParagraph para : cell.getTextParagraphs()) {
                    for (XSLFTextRun run : para.getTextRuns()) {
                        run.setFontSize(11.0);
                        run.setFontColor(Color.BLACK);
                    }
                }
            }
        }
    }

    /**
     * @Title setTableHeader
     * @Description 设置表格表头
     * @param placeholderTable
     * @param headers
     * @return void
    */
    public static void setTableHeader(XSLFTable placeholderTable, List<String> headers){
        XSLFTableRow headerRow = placeholderTable.addRow();
        for (String header : headers) {
            XSLFTableCell cell = headerRow.addCell();
            PPTUtils.setCellStyle(cell, header, Color.decode(HEADER_COLOR), true);
        }
    }

    /**
     * @Title setCellValue
     * @Description 设置单元格的值,并设置背景颜色和字体大小等样式
     * @param cell
     * @param value
     * @param bgColor
     * @param isHeader
     * @return void
    */
    public static void setCellStyle(XSLFTableCell cell, String value, Color bgColor, boolean isHeader) {
        XSLFTextParagraph paragraph = cell.addNewTextParagraph();
        XSLFTextRun run = paragraph.addNewTextRun();
        run.setText(value);
        run.setFontColor(Color.BLACK);
        if(isHeader){
            run.setFontSize(13.0);
            run.setBold(true);
        } else {
            run.setFontSize(11.0);
        }
        cell.setFillColor(bgColor);
        // 设置段落对齐方式为居中
        paragraph.setTextAlign(TextParagraph.TextAlign.CENTER);
    }
    /**
     * @Title setCellValue
     * @Description 设置单元格的值,并设置背景颜色和字体大小等样式, 并设置段落对齐方式为居右或居中
     * @param cell
     * @param value
     * @param bgColor
     * @param isHeader
     * @param isRight
     * @return void
    */
    public static void setCellStyle(XSLFTableCell cell, String value, Color bgColor, boolean isHeader, boolean isRight) {
        XSLFTextParagraph paragraph = cell.addNewTextParagraph();
        XSLFTextRun run = paragraph.addNewTextRun();
        run.setText(value);
        run.setFontColor(Color.BLACK);
        if(isHeader){
            run.setFontSize(13.0);
            run.setBold(true);
        } else {
            run.setFontSize(11.0);
        }
        cell.setFillColor(bgColor);
        // 设置段落对齐方式为居中
        if(isRight){
            paragraph.setTextAlign(TextParagraph.TextAlign.RIGHT);
        } else {
            paragraph.setTextAlign(TextParagraph.TextAlign.CENTER);
        }
    }
/**
     * @Title insertChartToSlide
     * @Description  将图表插入幻灯片(内存流)
     * @param slide
     * @param chart
     * @param width 图片宽度
     * @param height 图片高度
     * @param x 图片在幻灯片上的x坐标位置
     * @param y 图片在幻灯片上的y坐标位置
     * @return void
    */
    public static void insertChartToSlide(XSLFSlide slide, JFreeChart chart, int width, int height, int x, int y) throws Exception {
        // 创建指定大小的图表图像
        BufferedImage chartImage = chart.createBufferedImage(width, height);
        // 创建字节数组输出流用于存储图片数据
        ByteArrayOutputStream imageStream = new ByteArrayOutputStream();

        try {
            // 将图表图像以 PNG 格式写入字节数组输出流
            boolean success = ImageIO.write(chartImage, "PNG", imageStream);
            if (!success) {
                throw new IOException("无法将图表保存为 PNG 图片");
            }
            // 获取字节数组输出流中的字节数据
            byte[] imageBytes = imageStream.toByteArray();
            try (ByteArrayInputStream inputStream = new ByteArrayInputStream(imageBytes)) {
                // 将图片数据添加到幻灯片的幻灯片展示中
                XSLFPictureData pictureData = slide.getSlideShow().addPicture(
                        inputStream, XSLFPictureData.PictureType.PNG
                );
                // 在幻灯片上创建图片形状
                XSLFPictureShape picture = slide.createPicture(pictureData);
                // 设置图片在幻灯片上的位置和大小
                picture.setAnchor(new Rectangle2D.Double(x, y, width, height));
            }
        } finally {
            try {
                // 关闭字节数组输出流
                imageStream.close();
            } catch (IOException e) {
                e.printStackTrace();
            }
        }
    }

}
JFreeChartCreate 图表创建工具类
public class JFreeChartCreate {

    private static Font FONT = new Font("宋体", Font.PLAIN, 12);

    public static Color[] CHART_COLORS = { new Color(31, 129, 188), new Color(241, 92, 128), new Color(124, 181, 236), new Color(102, 172, 204),
            new Color(102, 102, 0), new Color(204, 153, 102), new Color(0, 153, 255), new Color(204, 255, 255), new Color(51, 153, 153),
            new Color(255, 204, 102), new Color(102, 102, 0), new Color(204, 204, 204), new Color(204, 255, 255), new Color(255, 204, 204),
            new Color(255, 255, 204), new Color(255, 153, 204), new Color(51, 0, 0), new Color(0, 51, 102), new Color(0, 153, 102), new Color(153, 102, 153),
            new Color(102, 153, 204), new Color(153, 204, 153), new Color(204, 204, 153), new Color(255, 255, 153), new Color(255, 204, 153),
            new Color(255, 153, 204), new Color(204, 153, 153), new Color(204, 204, 255), new Color(204, 255, 204), new Color(153, 204, 153),
            new Color(255, 204, 102) };//颜色


    /**
     * @Title createChart
     * @Description 创建 JFreeChart--周报第二张幻灯片
     * @param data
     * @return org.jfree.chart.JFreeChart
    */
    public static JFreeChart createChartWeekTwo(List<Map<String, Object>> data) {
        DefaultCategoryDataset dataset = new DefaultCategoryDataset();
        for (Map<String, Object> item : data) {
            String company = item.get("companyName").toString();
            double totalComplate = Double.parseDouble(item.get("totalComplate").toString());
            dataset.addValue(totalComplate, "总完成量", company);
        }
        JFreeChart chart = ChartFactory.createBarChart(
                "存量 累计网签完成情况", // 图表标题
                "", // 横轴标签
                "", // 纵轴标签
                dataset,
                PlotOrientation.VERTICAL,
                false, // 是否显示图例
                false, // 是否显示工具提示
                false // 是否生成 URL 链接
        );

        // 设置样式
        setBarChartStyle(dataset, chart);
        return chart;
    }


    /**
     * @Title setChartTheme
     * @Description 主题样式设置 解决乱码问题
     * @param
     * @return void
    */
    public static void setChartTheme() {
        // 设置中文主题样式 解决乱码
        StandardChartTheme chartTheme = new StandardChartTheme("CN");
        // 设置标题字体
        chartTheme.setExtraLargeFont(FONT);
        // 设置图例的字体
        chartTheme.setRegularFont(FONT);
        // 设置轴向的字体
        chartTheme.setLargeFont(FONT);
        chartTheme.setSmallFont(FONT);
        chartTheme.setTitlePaint(new Color(51, 51, 51));
        chartTheme.setSubtitlePaint(new Color(85, 85, 85));

        chartTheme.setLegendBackgroundPaint(Color.WHITE);// 设置标注
        chartTheme.setLegendItemPaint(Color.BLACK);//
        chartTheme.setChartBackgroundPaint(Color.WHITE);
//        // 绘制颜色绘制颜色.轮廓供应商
//        // paintSequence,outlinePaintSequence,strokeSequence,outlineStrokeSequence,shapeSequence
//
//        Paint[] OUTLINE_PAINT_SEQUENCE = new Paint[] { Color.WHITE };
//        //绘制器颜色源
//        DefaultDrawingSupplier drawingSupplier = new DefaultDrawingSupplier(CHART_COLORS, CHART_COLORS, OUTLINE_PAINT_SEQUENCE,
//                DefaultDrawingSupplier.DEFAULT_STROKE_SEQUENCE, DefaultDrawingSupplier.DEFAULT_OUTLINE_STROKE_SEQUENCE,
//                DefaultDrawingSupplier.DEFAULT_SHAPE_SEQUENCE);
//        chartTheme.setDrawingSupplier(drawingSupplier);
//
        chartTheme.setPlotBackgroundPaint(Color.WHITE);// 绘制区域
        chartTheme.setPlotOutlinePaint(Color.WHITE);// 绘制区域外边框
        chartTheme.setLabelLinkPaint(new Color(8, 55, 114));// 链接标签颜色
        chartTheme.setLabelLinkStyle(PieLabelLinkStyle.CUBIC_CURVE);
//
        chartTheme.setAxisOffset(new RectangleInsets(5, 12, 5, 12));
        chartTheme.setDomainGridlinePaint(new Color(192, 208, 224));// X坐标轴垂直网格颜色
        chartTheme.setRangeGridlinePaint(new Color(192, 192, 192));// Y坐标轴水平网格颜色
//
        chartTheme.setBaselinePaint(Color.WHITE);
        chartTheme.setCrosshairPaint(Color.BLUE);// 不确定含义
        chartTheme.setAxisLabelPaint(new Color(51, 51, 51));// 坐标轴标题文字颜色
        chartTheme.setTickLabelPaint(new Color(67, 67, 72));// 刻度数字
        chartTheme.setBarPainter(new StandardBarPainter());// 设置柱状图渲染
        chartTheme.setXYBarPainter(new StandardXYBarPainter());// XYBar 渲染
//
//        chartTheme.setItemLabelPaint(Color.black);
//        chartTheme.setThermometerPaint(Color.white);// 温度计

        ChartFactory.setChartTheme(chartTheme);
    }


    /**
     * @Title setBarChartStyle
     * @Description 设置柱状图样式
     * @param dataset
     * @param chart
     * @return void
    */
    private static void setBarChartStyle(DefaultCategoryDataset dataset, JFreeChart chart){
        // 设置横轴
        CategoryPlot plot = chart.getCategoryPlot();
        CategoryAxis domainAxis = plot.getDomainAxis();

//        domainAxis.setTickLabelFont(FONT);

        // 设置横向标题倾斜
        domainAxis.setCategoryLabelPositions(org.jfree.chart.axis.CategoryLabelPositions.createUpRotationLabelPositions(Math.PI / 6));

        // 设置纵轴
        NumberAxis rangeAxis = (NumberAxis) plot.getRangeAxis();
//        rangeAxis.setTickLabelFont(FONT);
        // 设置纵轴属性,避免科学计数法
        DecimalFormat format = new DecimalFormat("#,###");
        rangeAxis.setNumberFormatOverride(format);

        // 手动找出最大值
        double maxValue = Double.MIN_VALUE;
        for (int row = 0; row < dataset.getRowCount(); row++) {
            for (int col = 0; col < dataset.getColumnCount(); col++) {
                Number value = dataset.getValue(row, col);
                if (value != null) {
                    maxValue = Math.max(maxValue, value.doubleValue());
                }
            }
        }

        // 设置柱状图渲染器
        BarRenderer renderer = (BarRenderer) plot.getRenderer();
        renderer.setSeriesPaint(0, new Color(90, 174, 243));

        // 设置柱子上方显示数值
        CategoryItemLabelGenerator labelGenerator = new StandardCategoryItemLabelGenerator();
        renderer.setDefaultItemLabelGenerator(labelGenerator);
        renderer.setDefaultItemLabelsVisible(true);

        // 调整 TickUnit 以确保合适的刻度显示
        double tickUnitValue = calculateTickUnit(maxValue);
        rangeAxis.setTickUnit(new NumberTickUnit(tickUnitValue));

        // 设置主题样式
        setChartTheme();

        // 不启用抗锯齿防止文字模糊
        chart.setAntiAlias(false);
        chart.setTextAntiAlias(false);
    }

    /**
     * @Title calculateTickUnit
     * @Description 纵轴刻度单位计算
     * @param maxValue
     * @return double
    */
    private static double calculateTickUnit(double maxValue) {
        // 根据最大值计算合适的刻度单位
        double power = Math.pow(10, Math.floor(Math.log10(maxValue)));
        if (maxValue / power < 2) {
            return power / 2;
        } else if (maxValue / power < 5) {
            return power;
        } else {
            return 2 * power;
        }
    }
}
前端注备
前端需要各一个按钮和下载方法,这里不一一列举了
三、模板准备
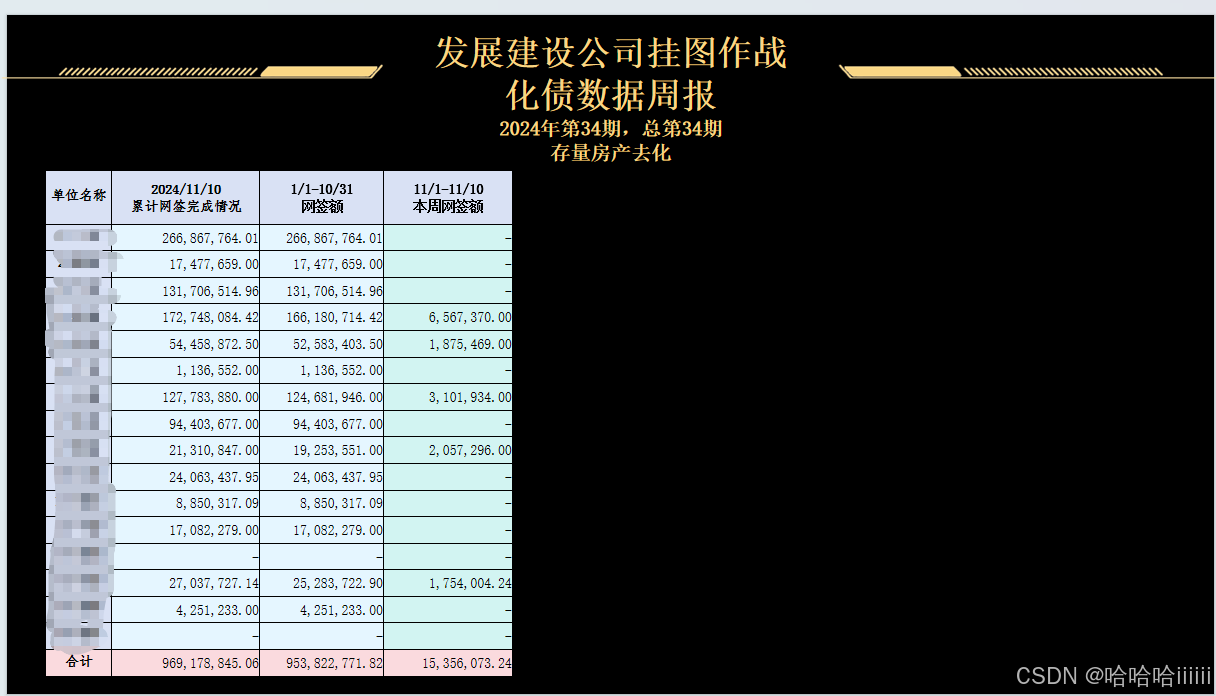
在本地盘下的某一目录下 \houseLedger\目录下注备exportWeek.pptx
设置第二张幻定片为深色背景,因代码是根据占位表格来操作的,建立类似如下表格;
四、总结
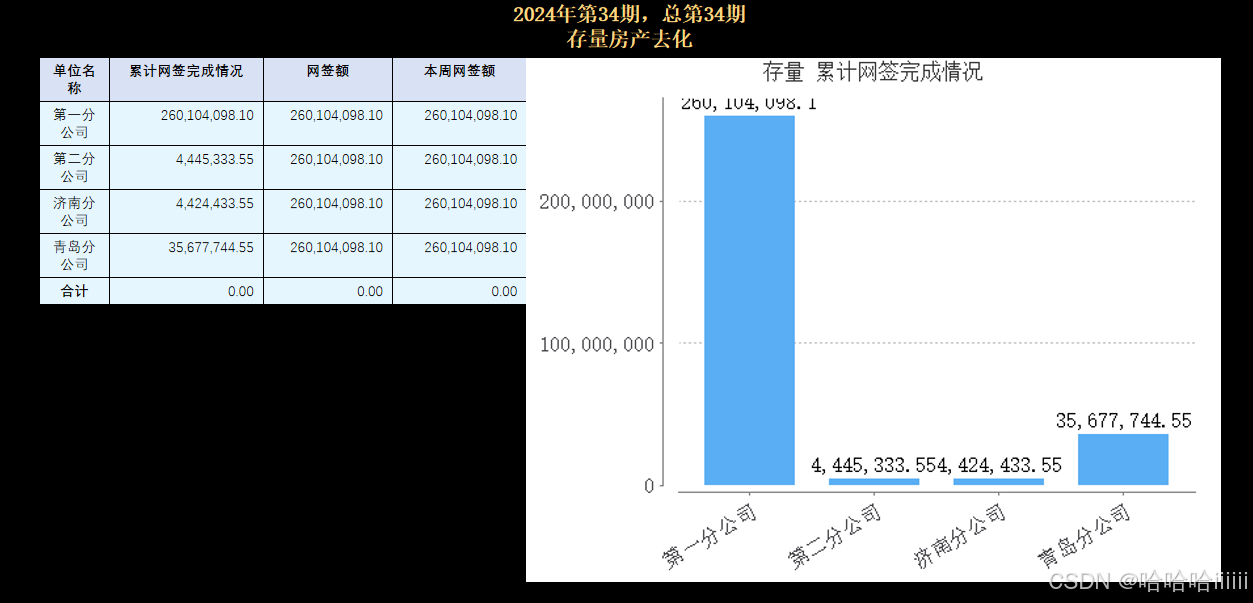
导出结果如下图:合计仅示例,没计算!


 扫一扫
扫一扫


 410
410

 被折叠的 条评论
为什么被折叠?
被折叠的 条评论
为什么被折叠?
 到【灌水乐园】发言


