




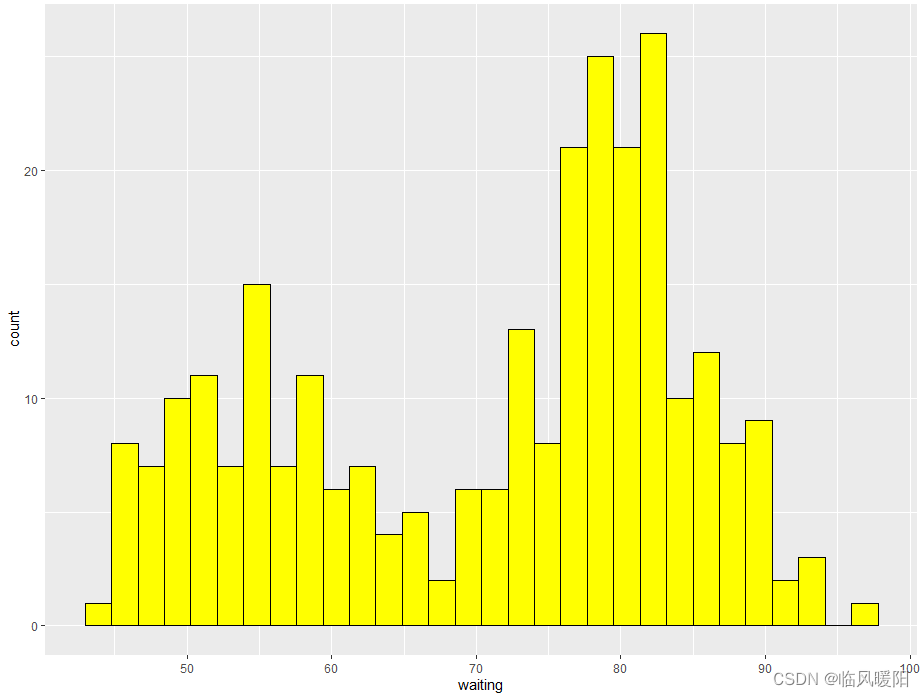
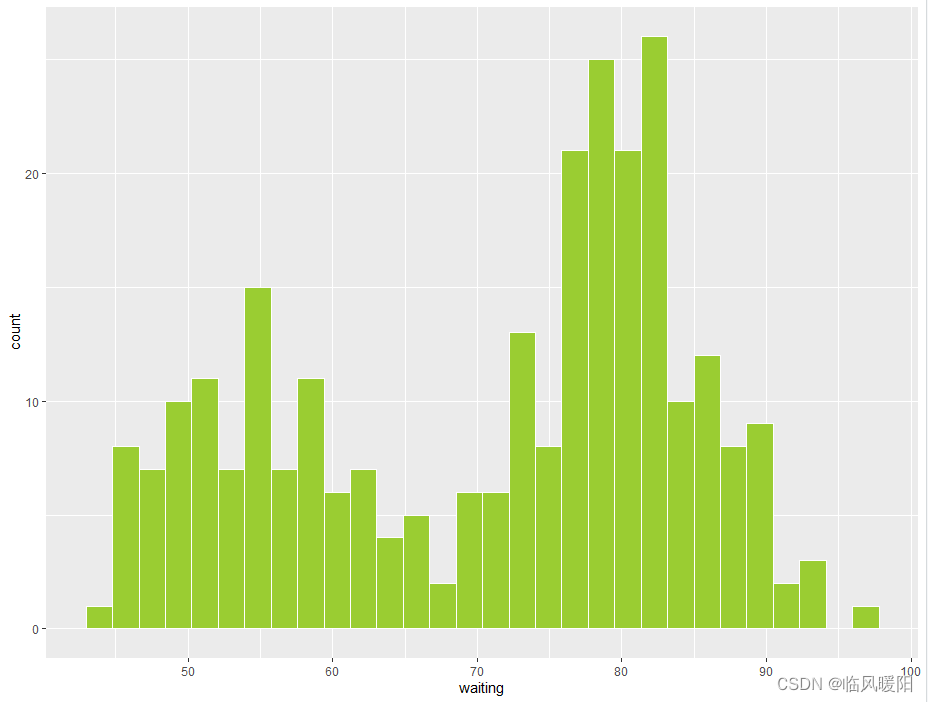
 该博客展示了使用R语言`ggplot2`包绘制`faithful`数据集中的`waiting`变量的直方图。通过改变填充颜色和设置不同数量的柱状间隔,创建了一系列美观的直方图,用于展示等待时间的分布情况。每个图都用白色边框和不同色调的填充色,其中部分图设置了特定的柱状数量。
library(gcookbook) # For the data set
library(tidyverse)

ggplot(faithful, aes(x=waiting)) + geom_histogram(colour='black',fill='lightblue')
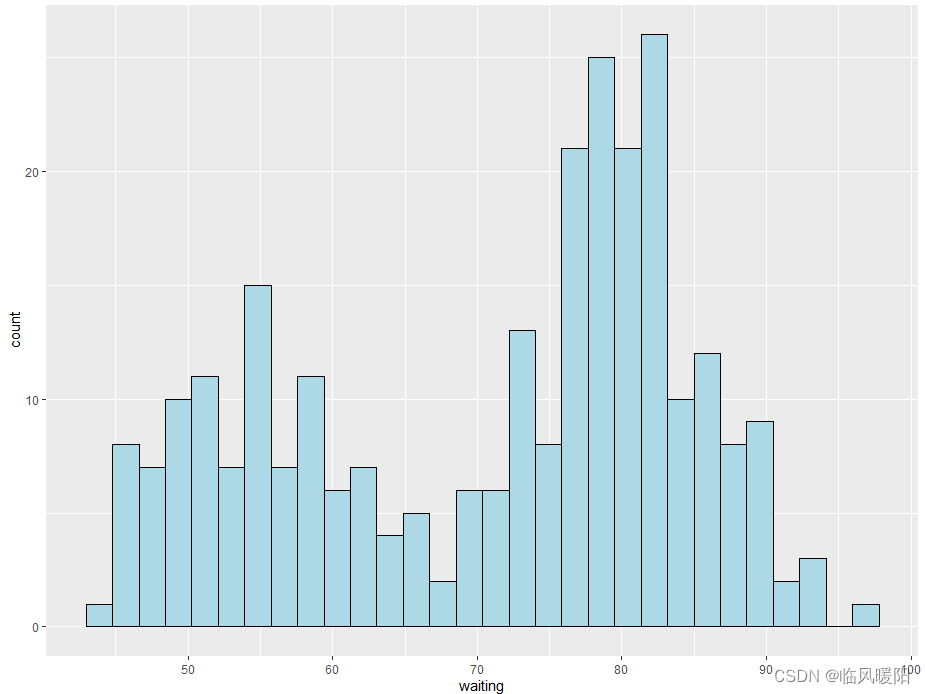
ggplot(faithful, aes(x=waiting)) + geom_histogram(colour='white',fill='lightcoral')
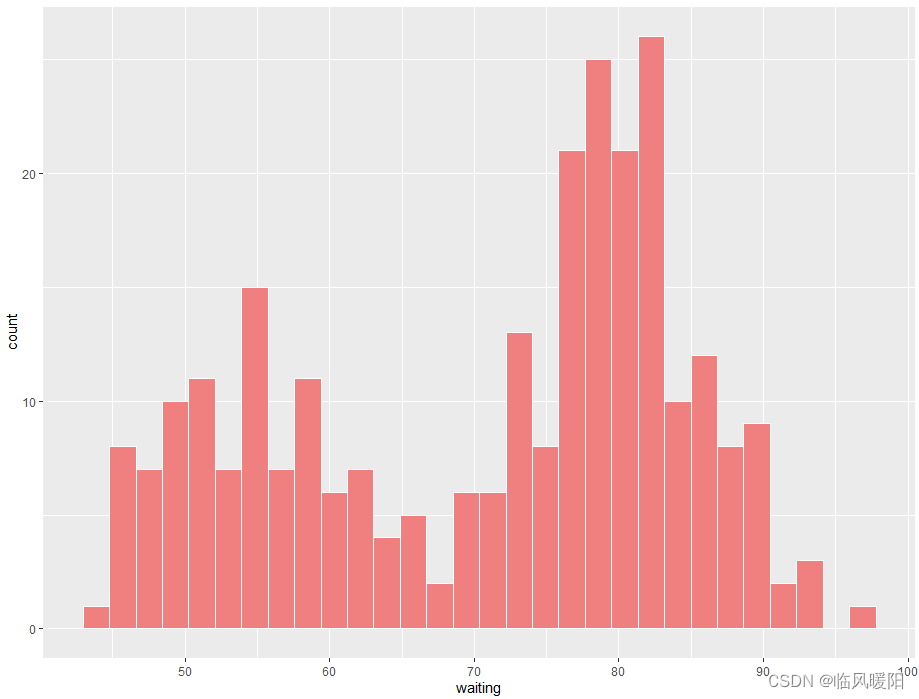
ggplot(faithful, aes(x=waiting)) + geom_histogram(colour='black',fill='lightcyan')
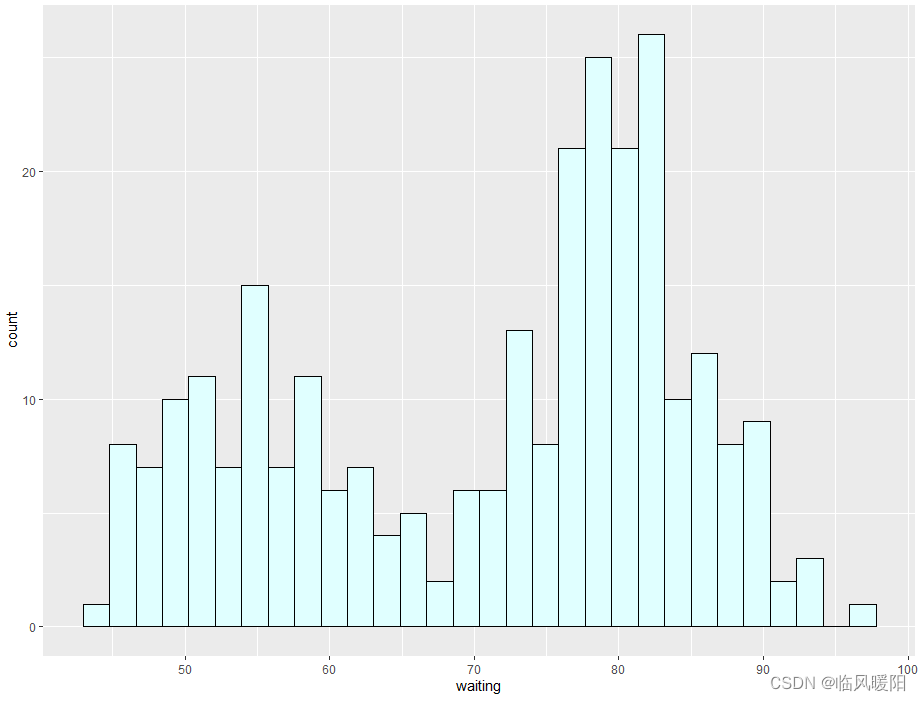
ggplot(faithful, aes(x=waiting)) + geom_histogram(colour='black',fill='lightgoldenrodyellow')
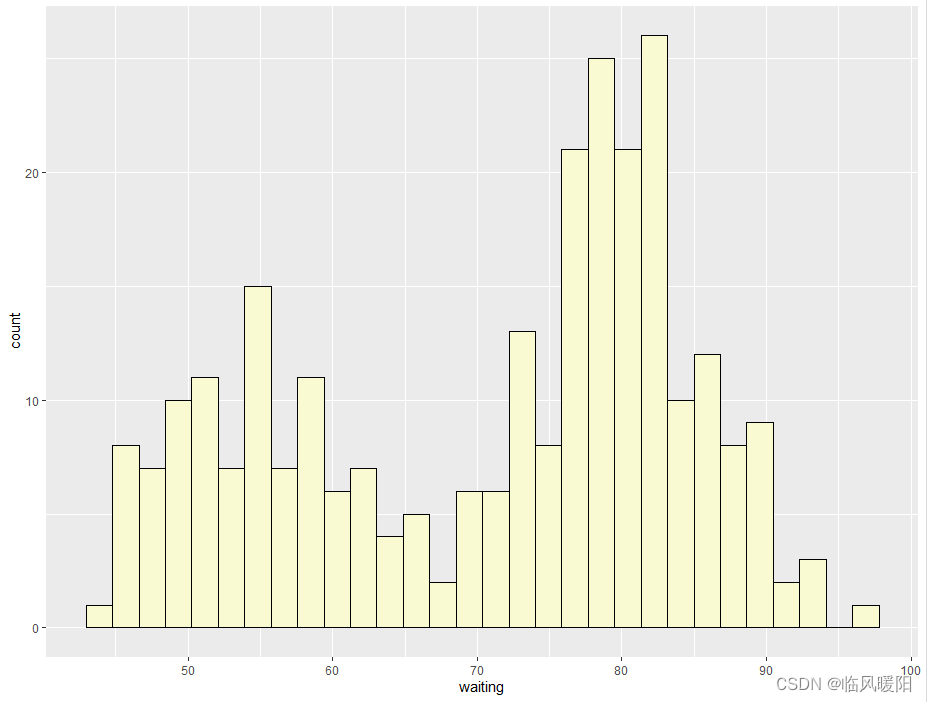
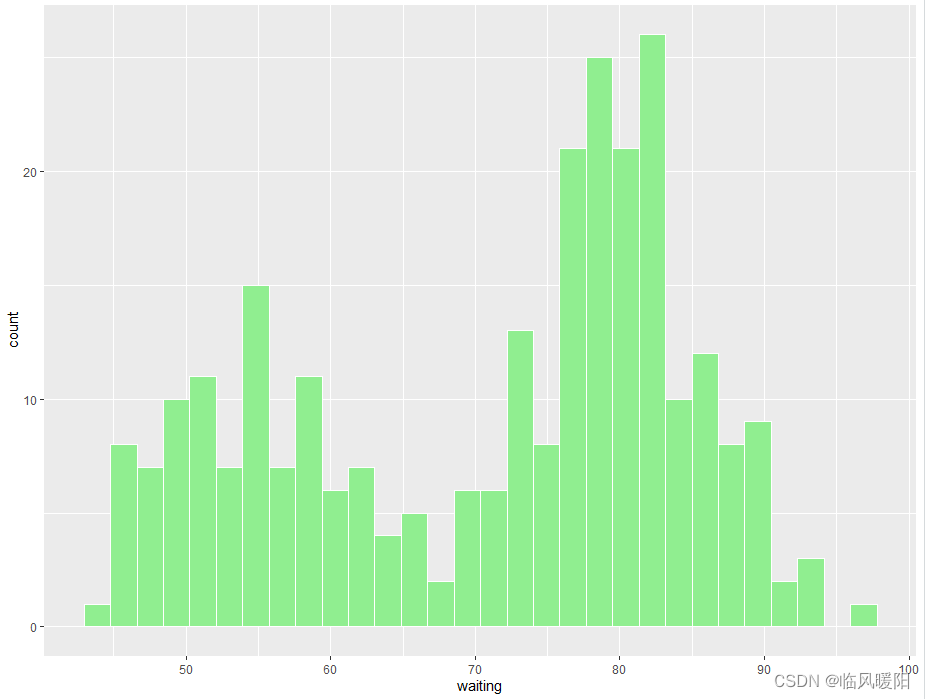
ggplot(faithful, aes(x=waiting)) + geom_histogram(colour='white',fill='lightgreen')
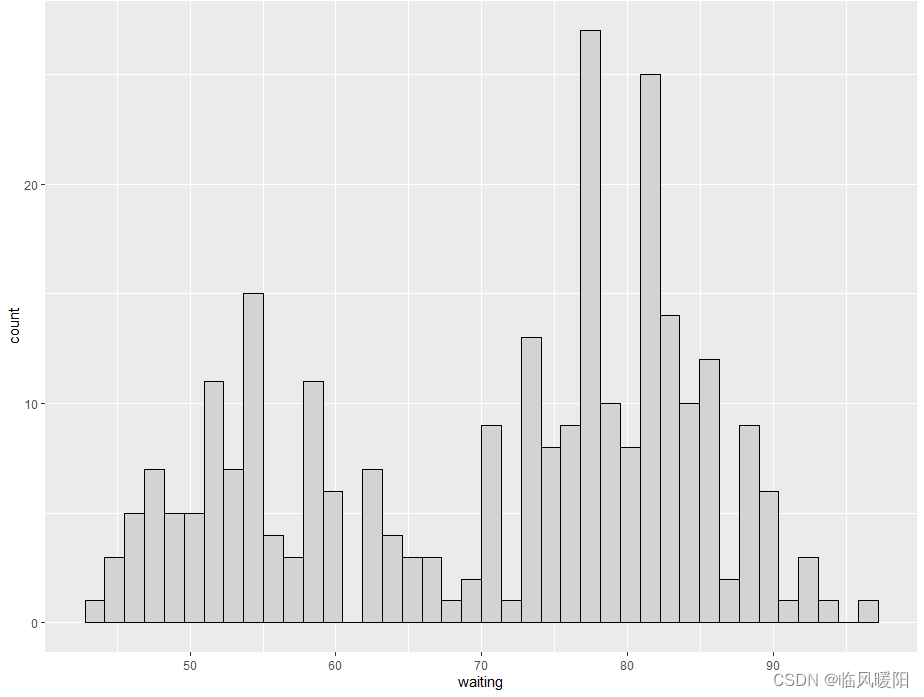
ggplot(faithful, aes(x=waiting)) + geom_histogram(colour='black',fill='lightgray',bins=40)
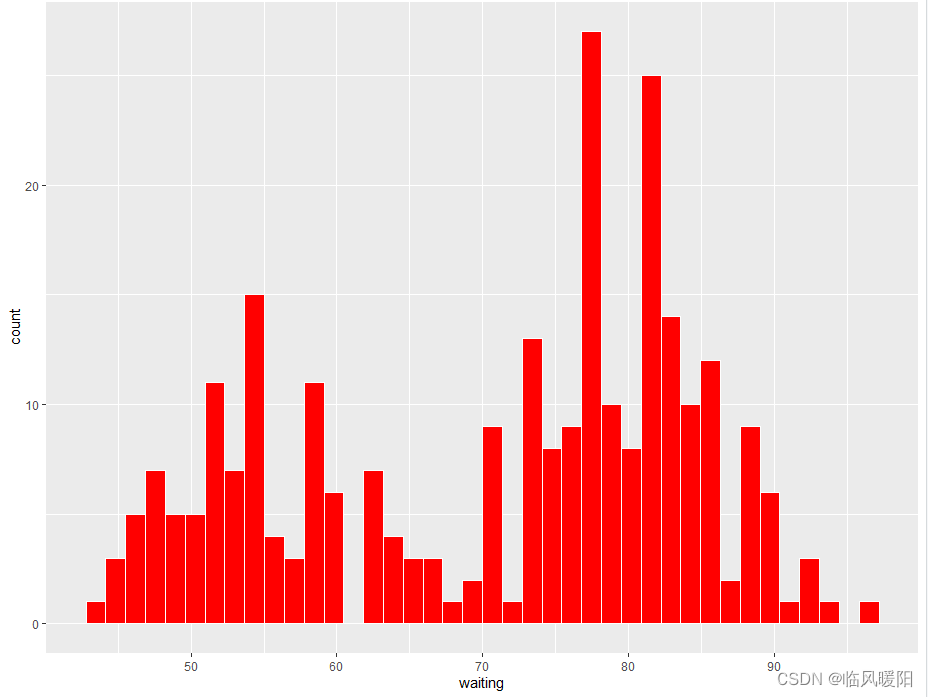
ggplot(faithful, aes(x=waiting)) + geom_histogram(colour='white',fill='red',bins=40)
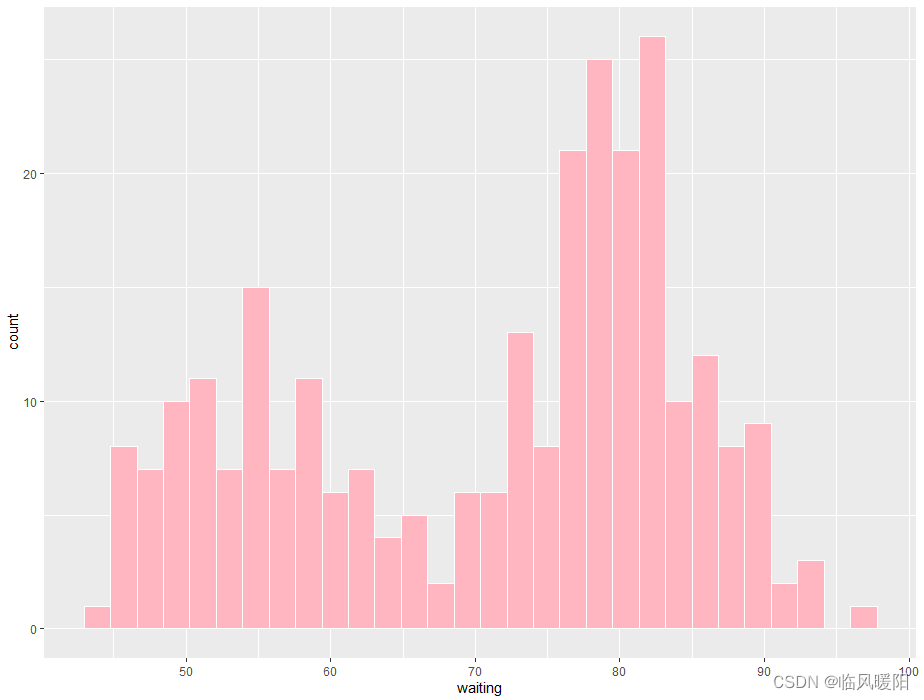
ggplot(faithful, aes(x=waiting)) + geom_histogram(colour='white',fill='lightpink',bins=30)
ggplot(faithful, aes(x=waiting)) + geom_histogram(colour='white',fill='lightsalmon',bins=30)
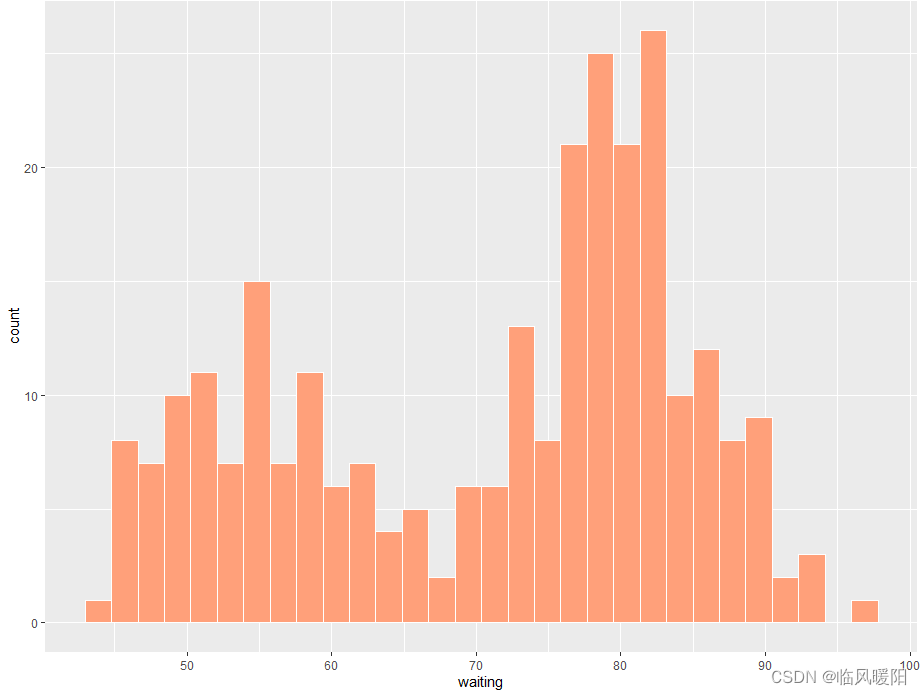
ggplot(faithful, aes(x=waiting)) + geom_histogram(colour='white',fill='lightseagreen',bins=30)
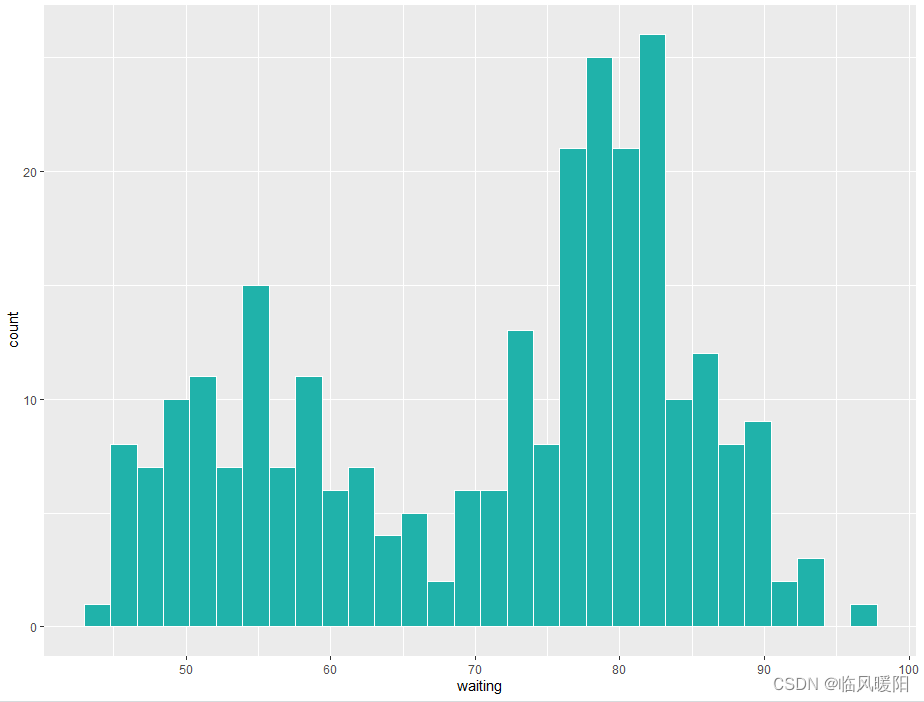
ggplot(faithful, aes(x=waiting)) + geom_histogram(colour='white',fill='lightskyblue',bins=30)
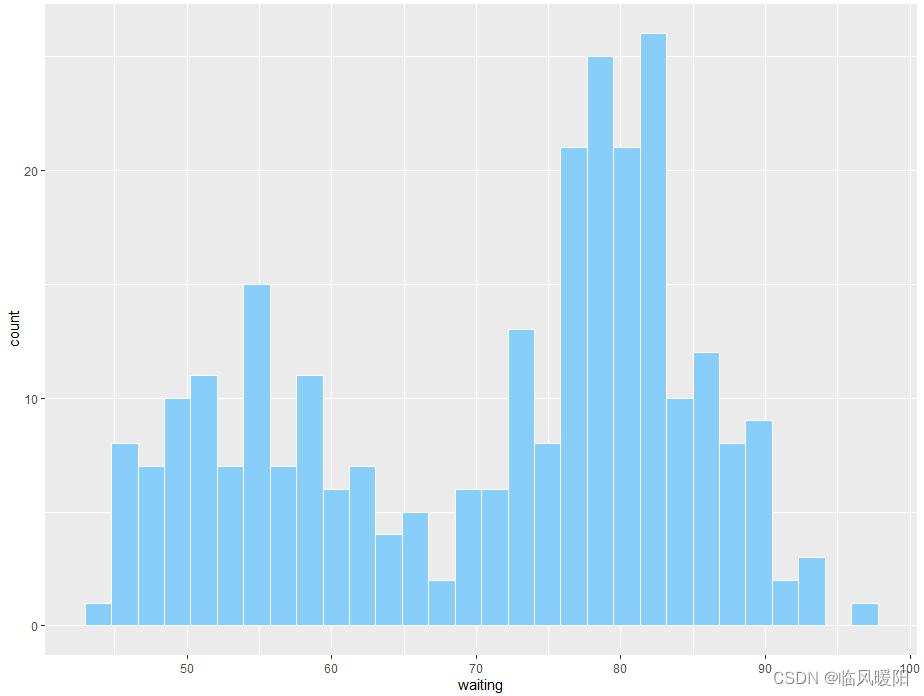
ggplot(faithful, aes(x=waiting)) + geom_histogram(colour='white',fill='lightslategray',bins=30)
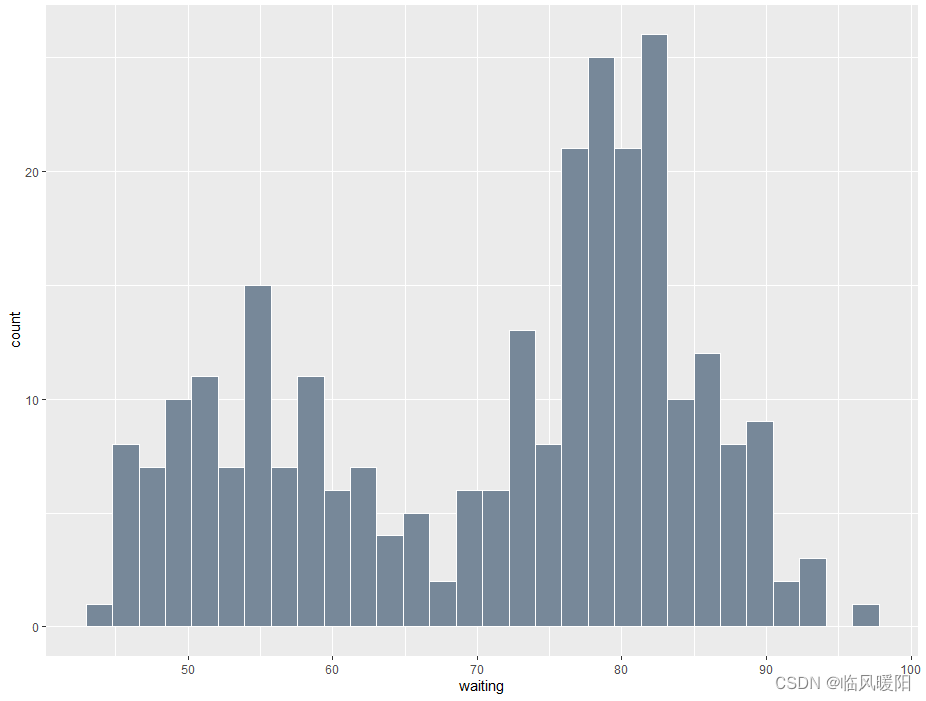
ggplot(faithful, aes(x=waiting)) + geom_histogram(colour='white',fill='slateblue',bins=30)
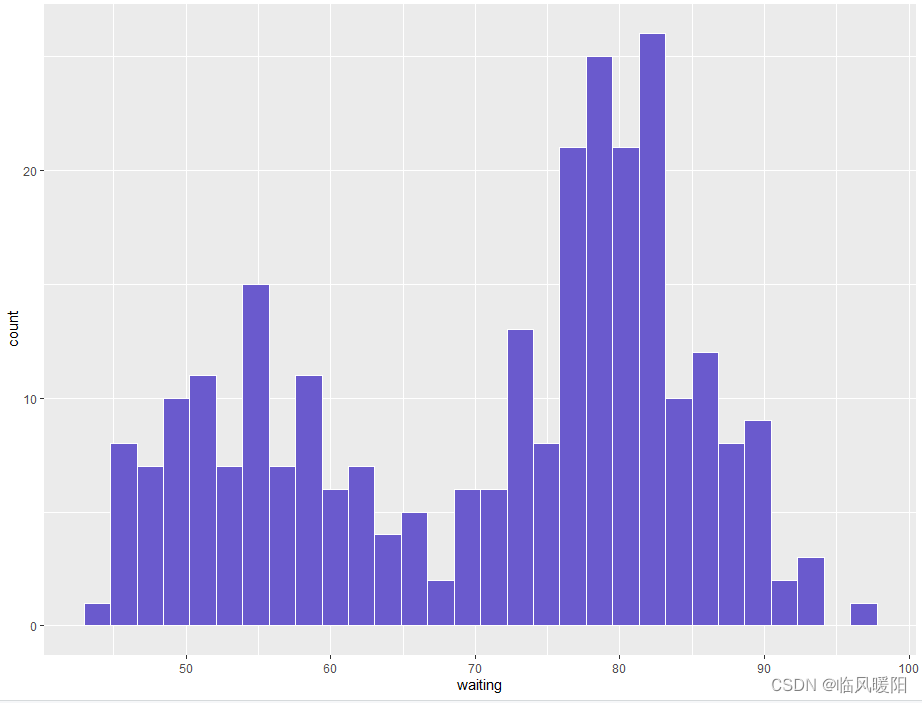
ggplot(faithful, aes(x=waiting)) + geom_histogram(colour='white',fill='sienna',bins=30)
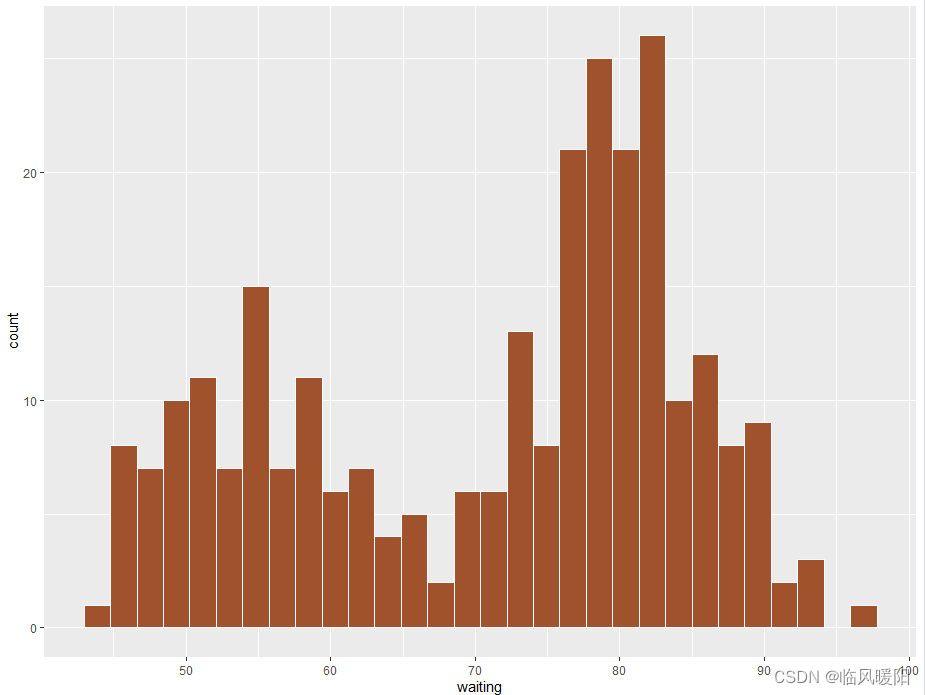
ggplot(faithful, aes(x=waiting)) + geom_histogram(colour='white',fill='skyblue',bins=30)
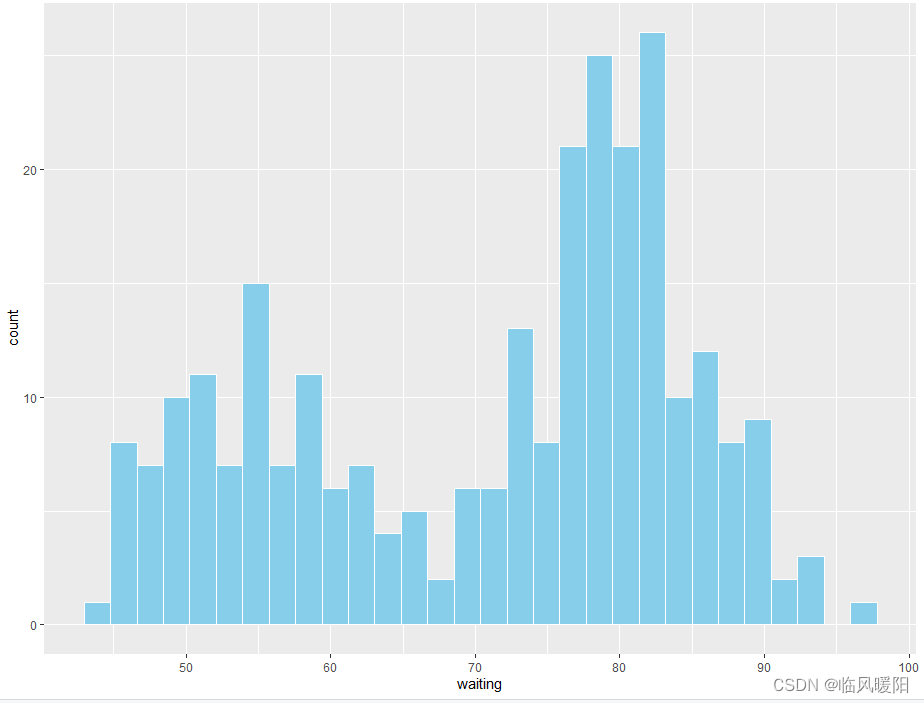
ggplot(faithful, aes(x=waiting)) + geom_histogram(colour='white',fill='slateblue',bins=30)
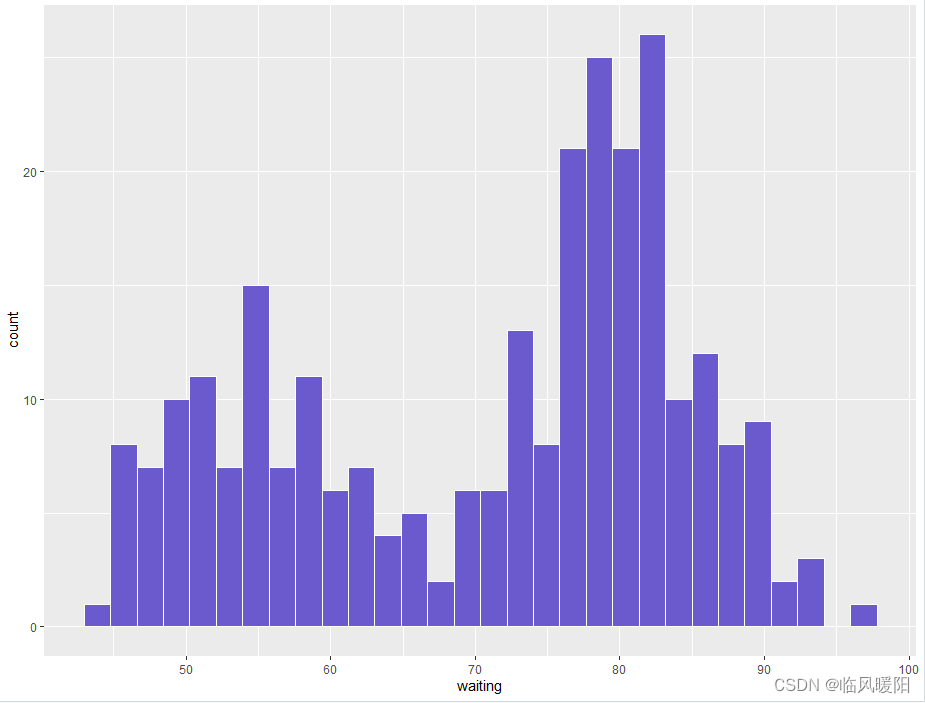
ggplot(faithful, aes(x=waiting)) + geom_histogram(colour='white',fill='slategray',bins=30)
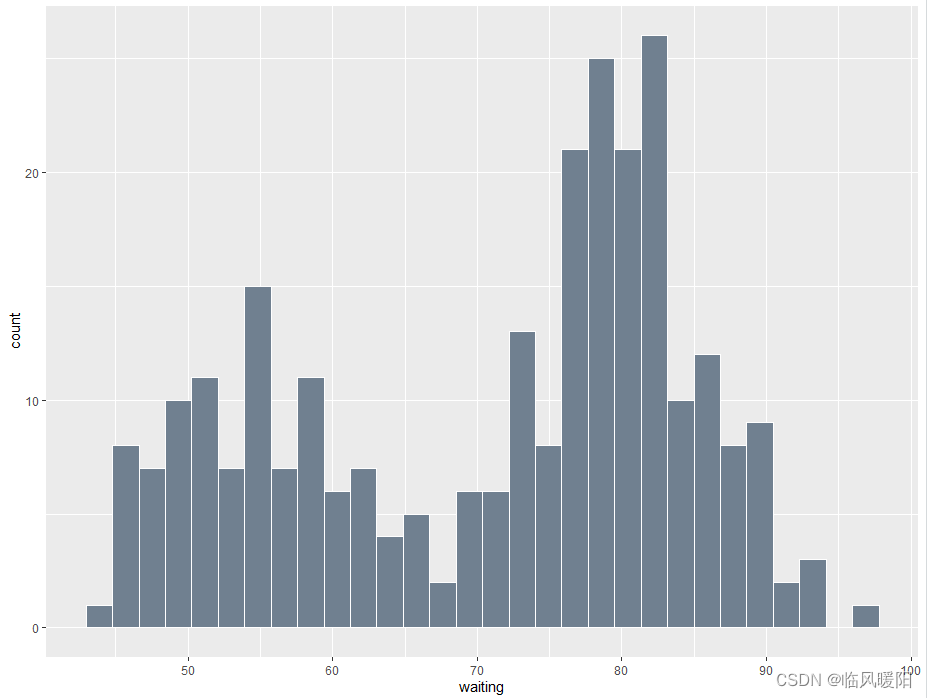
ggplot(faithful, aes(x=waiting)) + geom_histogram(colour='black',fill='snow',bins=30)
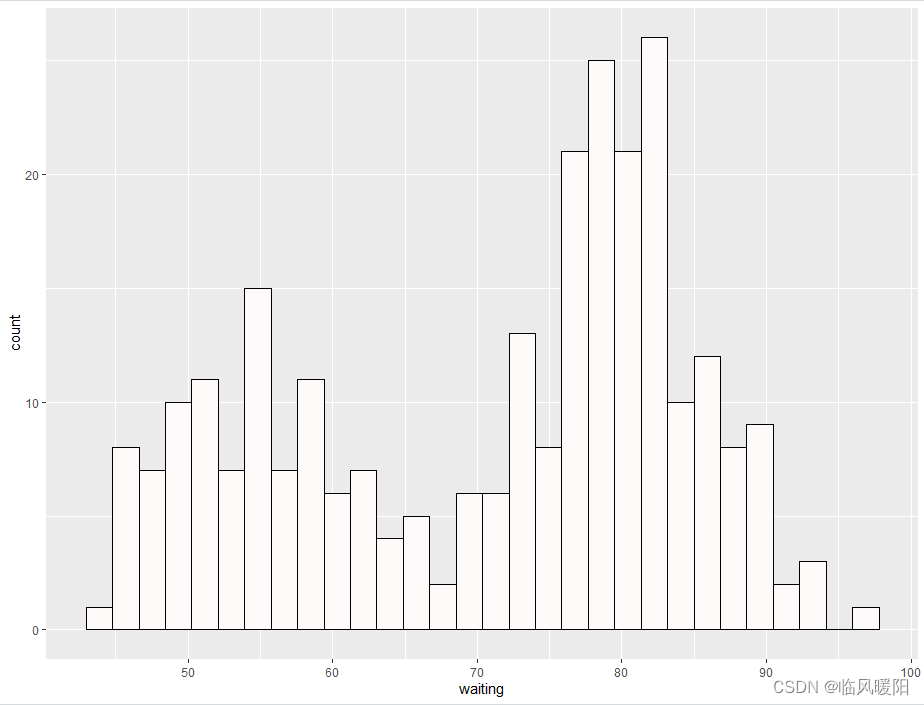
ggplot(faithful, aes(x=waiting)) + geom_histogram(colour='black',fill='springgreen',bins=30)
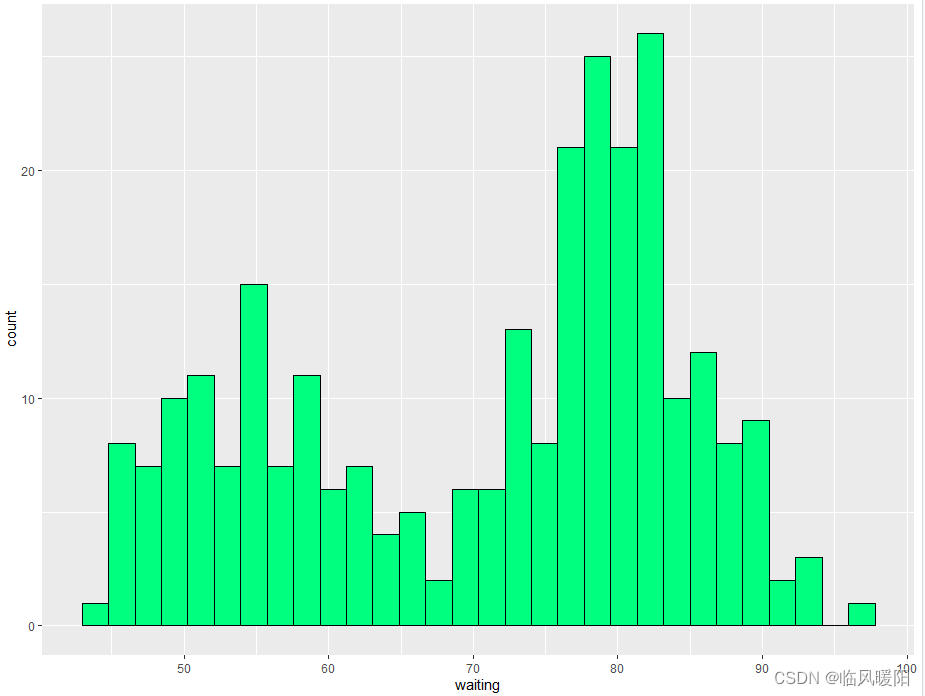
ggplot(faithful, aes(x=waiting)) + geom_histogram(colour='white',fill='steelblue',bins=30)
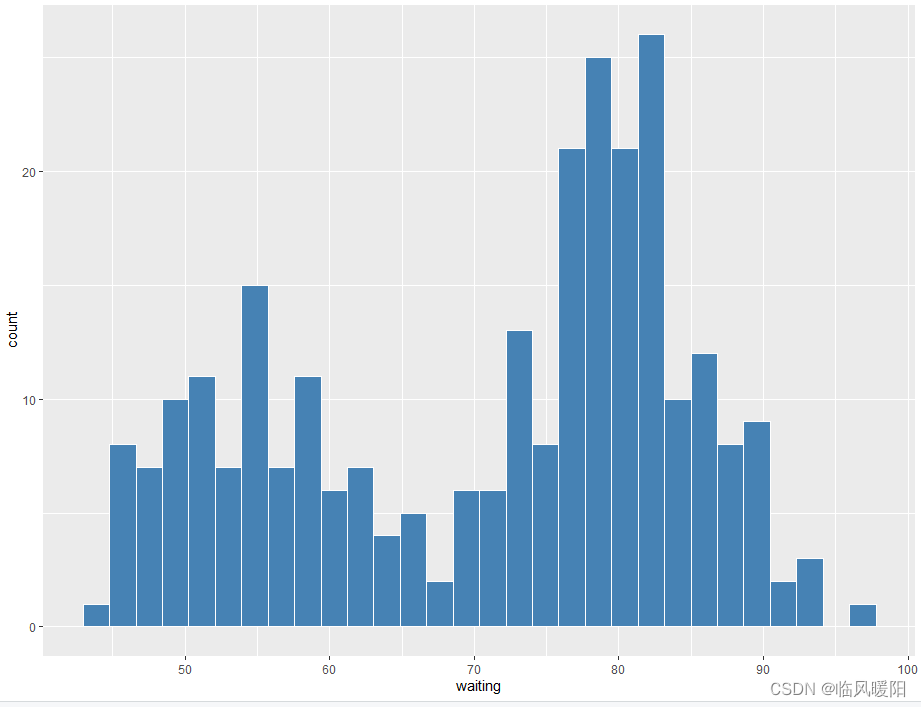
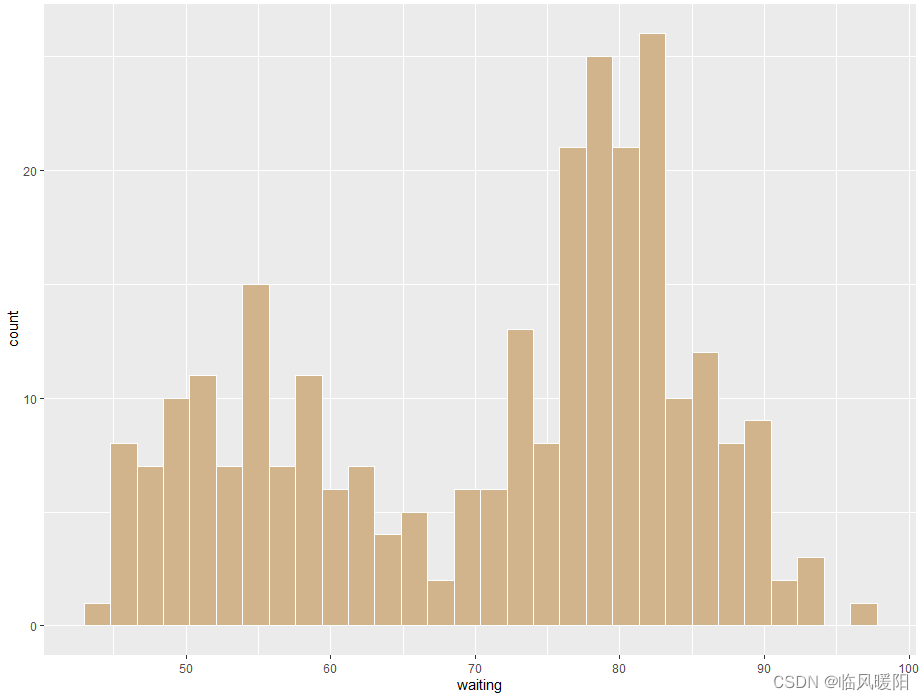
ggplot(faithful, aes(x=waiting)) + geom_histogram(colour='white',fill='tan',bins=30)
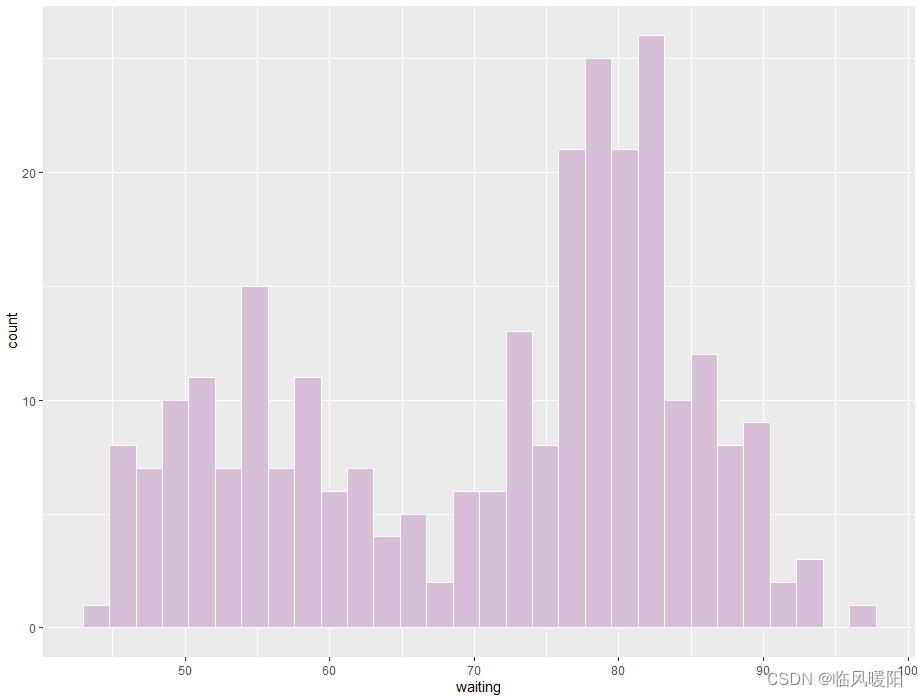
ggplot(faithful, aes(x=waiting)) + geom_histogram(colour='white',fill='thistle',bins=30)
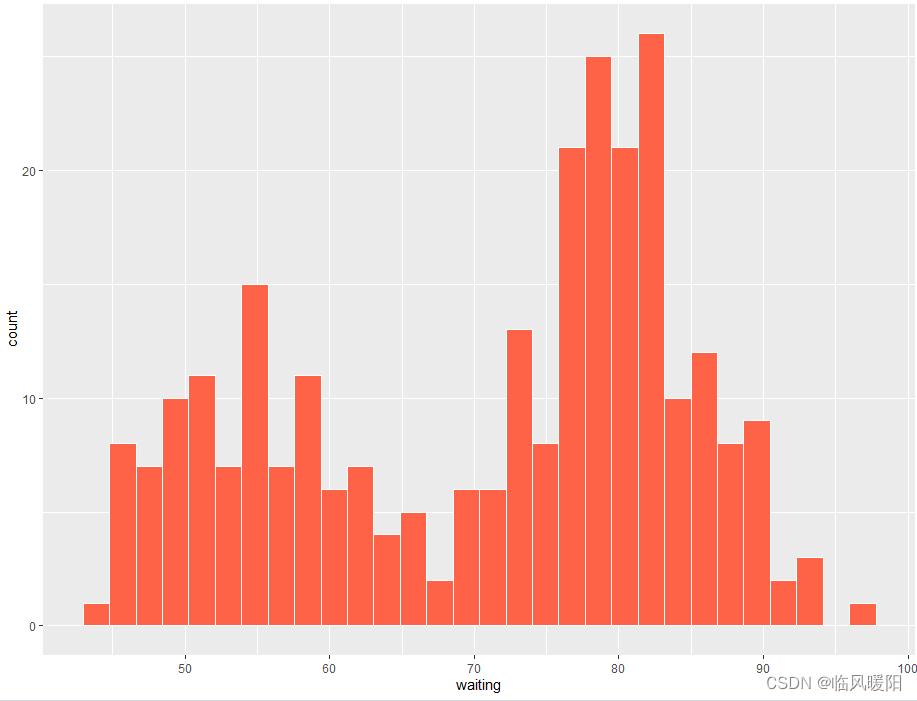
ggplot(faithful, aes(x=waiting)) + geom_histogram(colour='white',fill='tomato',bins=30)
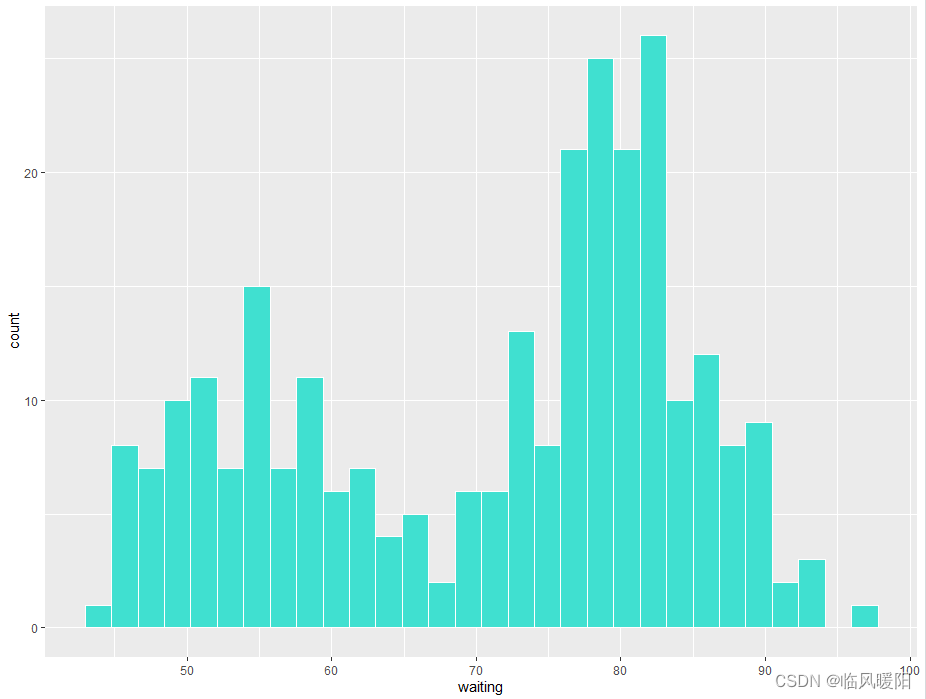
ggplot(faithful, aes(x=waiting)) + geom_histogram(colour='white',fill='turquoise',bins=30)
ggplot(faithful, aes(x=waiting)) + geom_histogram(colour='white',fill='blue',bins=30)
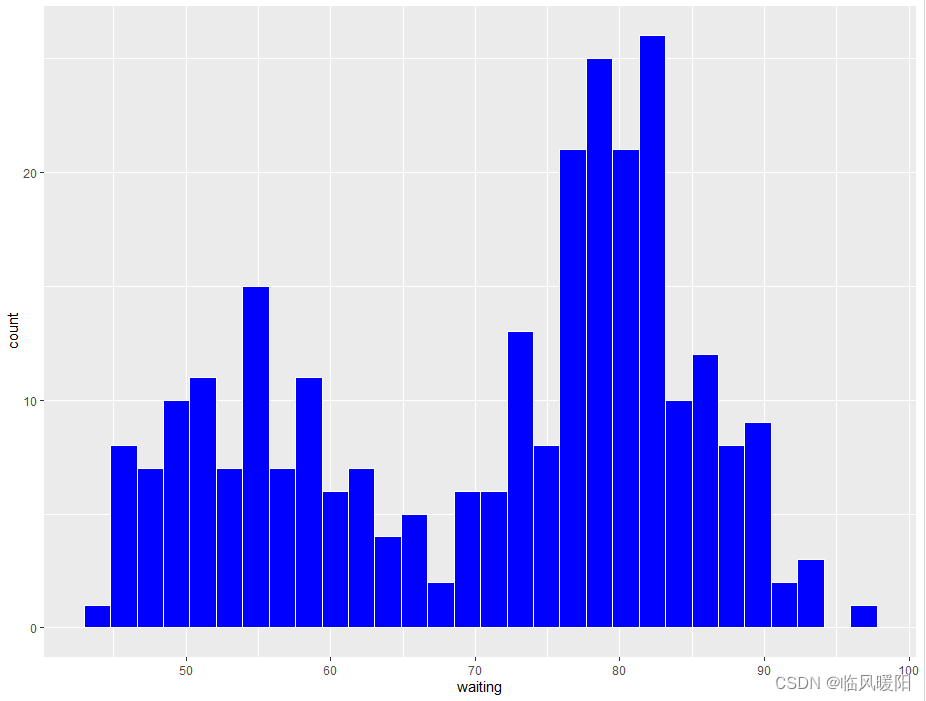
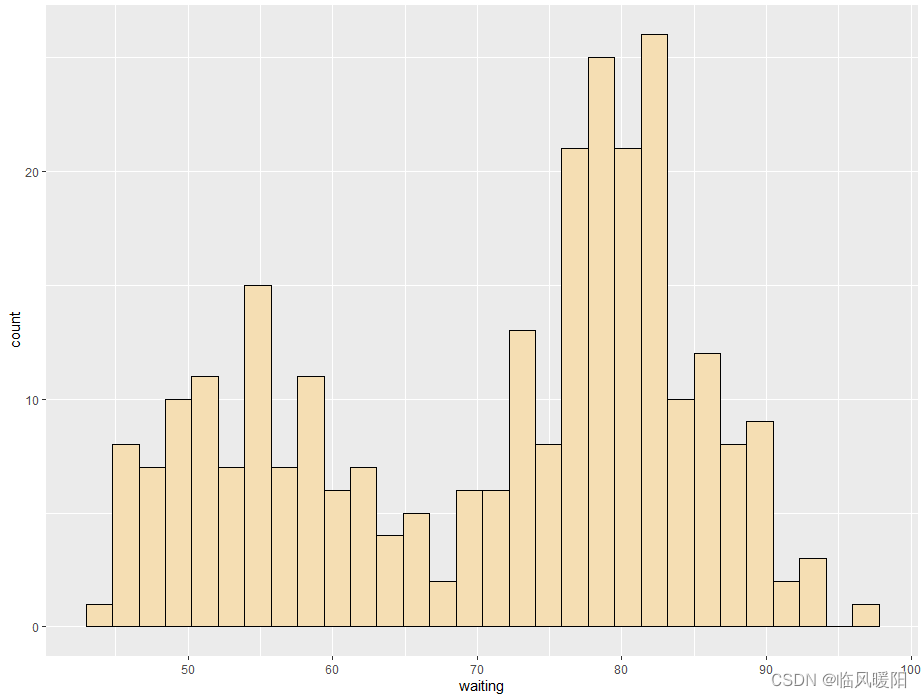
ggplot(faithful, aes(x=waiting)) + geom_histogram(colour='black',fill='wheat',bins=30)
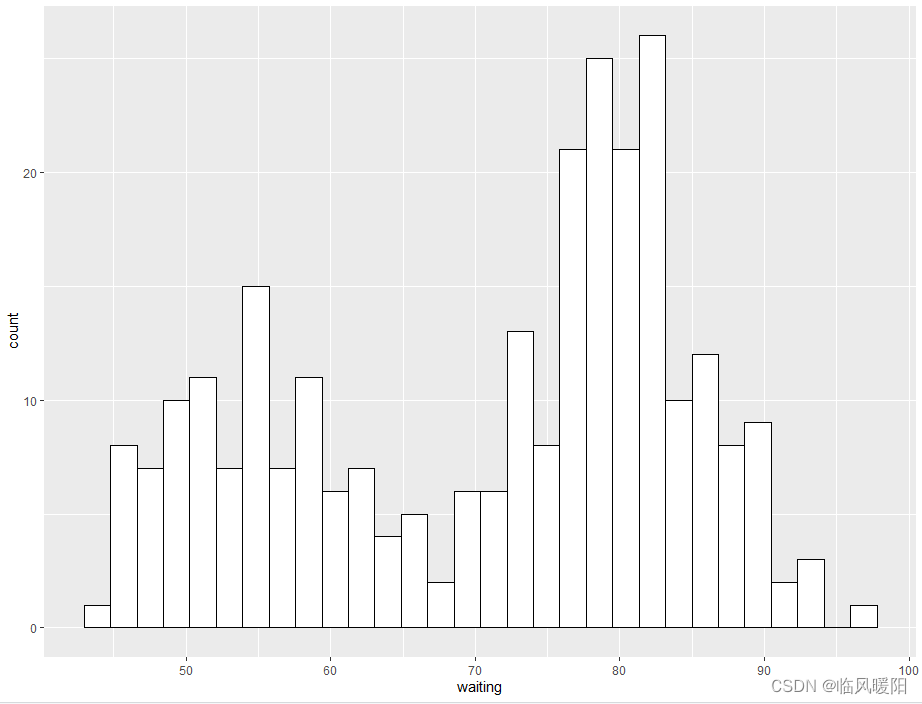
ggplot(faithful, aes(x=waiting)) + geom_histogram(colour='black',fill='white',bins=30)
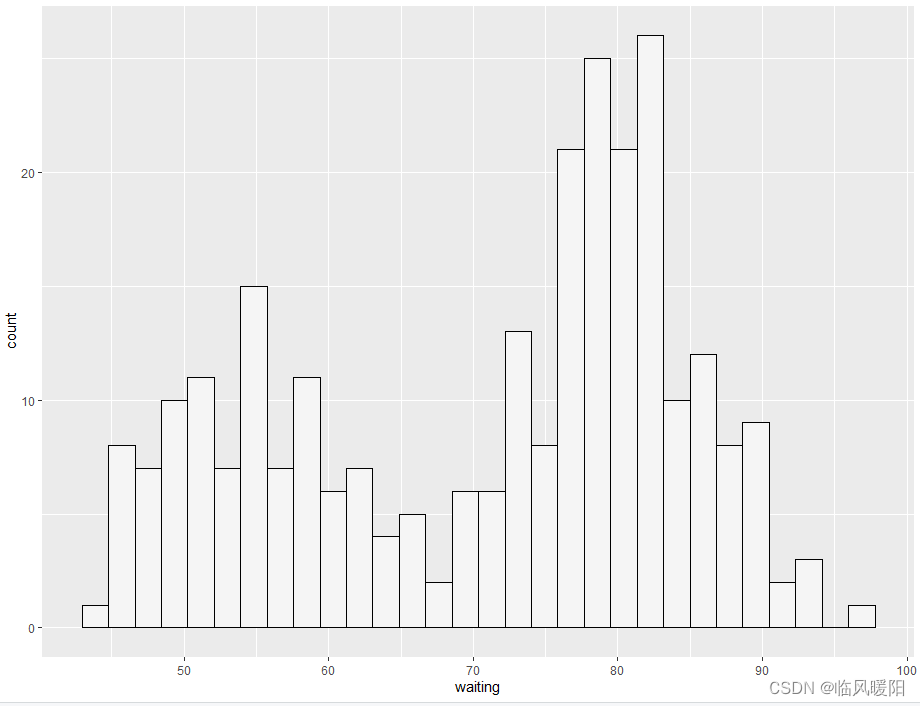
ggplot(faithful, aes(x=waiting)) + geom_histogram(colour='black',fill='whitesmoke',bins=30)
ggplot(faithful, aes(x=waiting)) + geom_histogram(colour='black',fill='yellow',bins=30)
ggplot(faithful, aes(x=waiting)) + geom_histogram(colour='white',fill='yellowgreen',bins=30)
参考文献:Practical Receipes for Visualizing Data----R Graphics Cookbook —Winston Chang O’REILLY
百度文库—颜色大全:含中英文对照及色值
开发环境:RStudio和微信截屏工具


 扫一扫
扫一扫


 514
514

 被折叠的 条评论
为什么被折叠?
被折叠的 条评论
为什么被折叠?
 到【灌水乐园】发言


