




数据源
- 导入包
import matplotlib.pyplot as plt

from mpl_toolkits.mplot3d import Axes3D
- 绘制3D折线图
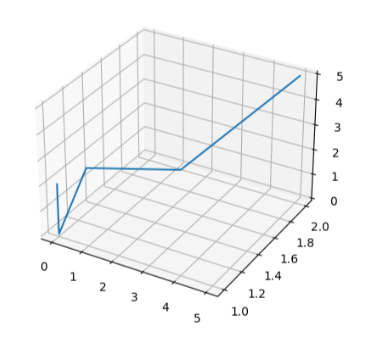
projection设置当前绘图环境为三维
分别设置XYZ三个维度的点
plt.subplot(projection='3d')

x = (0, 0, 1, 4, 5)

y = (1, 1, 1, 1, 2)

z = (2, 0, 3, 4, 5)

plt.plot(x, y, z)

plt.show()
- 数据源
frame = pd.read_csv("股票数据.csv", encoding='GBK') # 将数据加载成DataFrame格式

frame = frame.set_index("日期") # 将日期设置为索引

frame.index = pd.to_datetime(frame.index) # 转换为Datetime时间类型,方便后续处理

frame.head(5)
- 按年月份分组
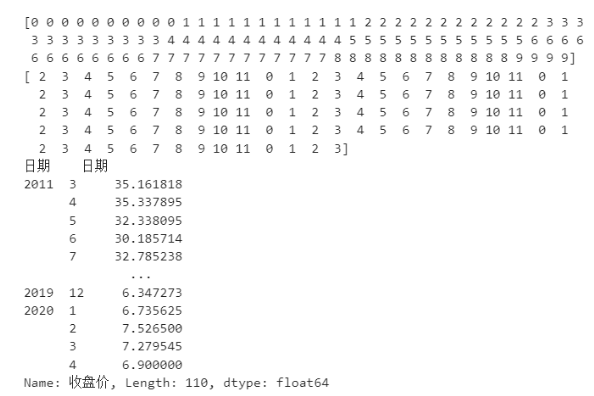
results = frame[['收盘价']].groupby([frame.index.year, frame.index.month]).mean()

print(results.index.codes[0]) # 第一个分组条件,即 年

print(results.index.codes[1]) # 第二个分组条件,即 月

print(results['收盘价'])
- plot绘制三维折线图
plt.subplot(projection='3d')

plt.plot(results.index.codes[0], results.index.codes[1], results['收盘价'])

plt.show()
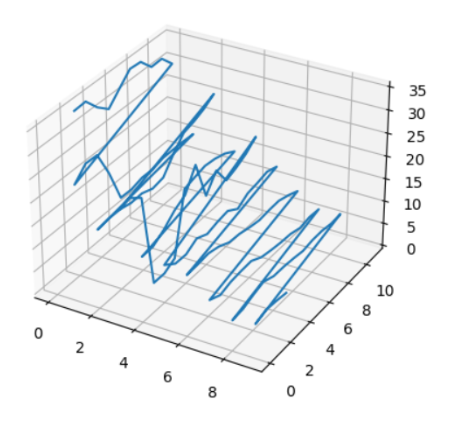
横向是年的变化 纵向是月的变化
- 按照年月分类汇总多个信息
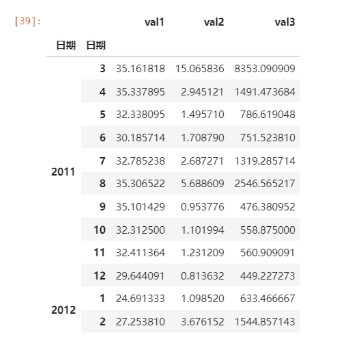
results = frame.groupby([frame.index.year, frame.index.month]).agg(val1=("收盘价", 'mean'), val2=("换手率", 'mean'), val3=("成交笔数", 'mean'))

results.head(12)
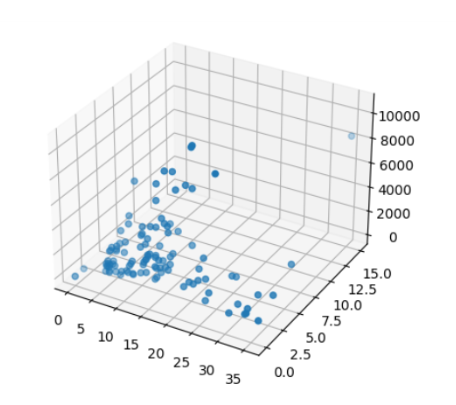
- scatter绘制3D散点图
ax = plt.subplot(projection='3d')

ax.scatter(results['val1'], results['val2'], results['val3'])

plt.show()
- bar3D柱状图
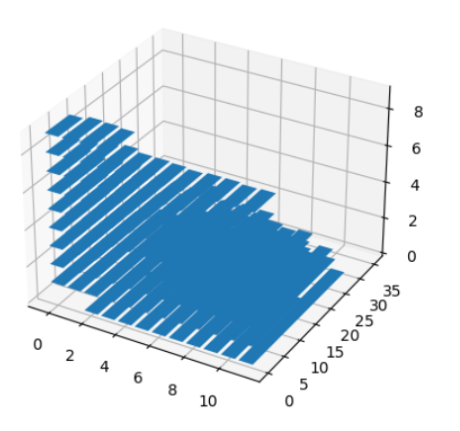
plt.subplot(projection='3d')

results = frame[['收盘价']].groupby([frame.index.year, frame.index.month]).mean()

plt.bar(results.index.codes[1], results['收盘价'], zs=results.index.codes[0]) # zs表示第三维度,即年份

plt.show()
- 设置3D图颜色
plt.subplot(projection='3d')

results = frame[['收盘价']].groupby([frame.index.year, frame.index.month]).mean()

plt.bar(results.index.codes[1], results['收盘价'], zs=results.index.codes[0], color=cm.ScalarMappable().to_rgba(results.index.codes[0]))

plt.show()
- 绘制3D柱状图bar3d
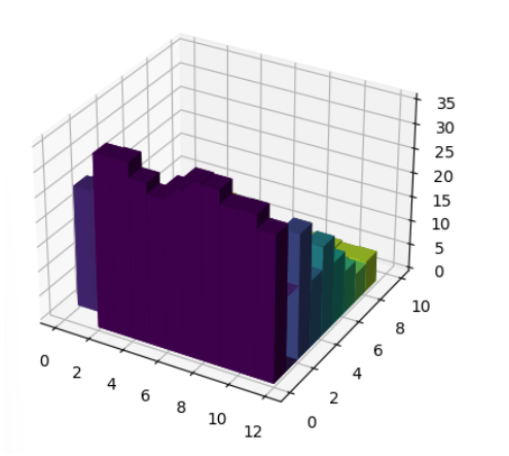
x y x分别是每个方柱底部点的坐标,dx dy代表每个方块的宽度和厚度,高度用收盘价等统计数据
ax = plt.subplot(projection='3d')

ax.bar3d(x=results.index.codes[1], y=results.index.codes[0], z=0, dx=1, dy=1, dz=results['收盘价'], color=cm.ScalarMappable().to_rgba(results.index.codes[0]))

plt.show()


 扫一扫
扫一扫


 3017
3017

 被折叠的 条评论
为什么被折叠?
被折叠的 条评论
为什么被折叠?
 到【灌水乐园】发言


