



What's New In QtGraphs 6.9
QtGraphs 6.9的新增功能
January 14, 2025 by Owais Akhtar | Comments
2025年1月14日由Owais Akhtar发表|评论
QtGraphs recently moved out of tech preview in Qt 6.8 and now, with 6.9, brings more improvements to the table encompassing some new features and a lot of bug-fixes. Let's look at some of the new features added:
QtGraphs最近在Qt 6.8中退出了技术预览版,现在有了6.9,带来了更多的改进,包括一些新功能和许多错误修复。让我们来看看添加的一些新功能:
Graph Injection in QtQuick3D
QtQuick3D中的Graph注入
Being able to view graphs inside of a scene is quite a useful feature, and now with 6.9, graphs can be injected inside a QtQuick3D application by using the convenient "importScene" property of View3D.
能够在场景中查看图表是一个非常有用的功能,现在有了6.9,可以通过使用View3D的方便的“importScene”属性将图形注入QtQuick3D应用程序中。
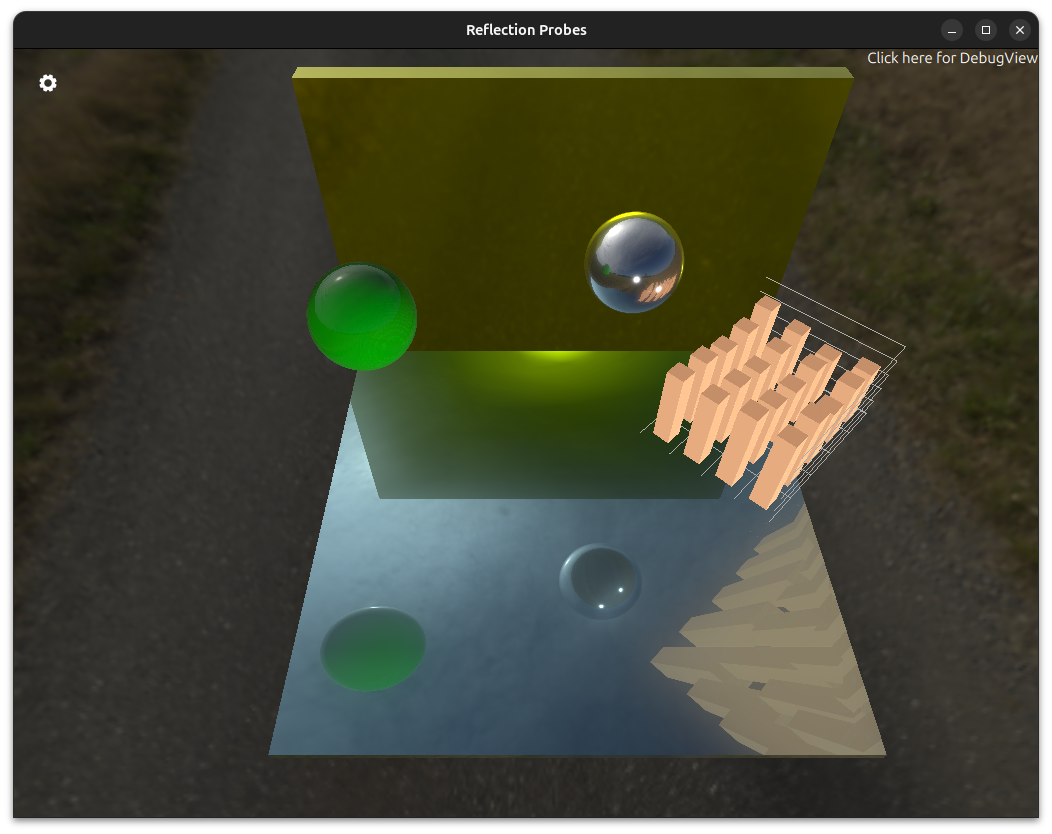
Here you can see a Bar Graph injected using the "importScene" function to combine it into one with a QtQuick3D scene. This can allow having graphs in complex environments and using them with more stylistic approaches. Furthermore, support for picking has also been added so the individual graph items can be selected.
在这里,可以看到使用“importScene”函数注入的条形图表,将其与QtQuick3D场景组合在一起。这可以允许在复杂的环境中使用图形,并以更具风格的方法使用它们。此外,还添加了对拾取的支持,因此可以选择单个图表项。
Transparency Support in Surface3D
Surface3D中的透明度支持
Surface3D now takes advantage of Order-Independent Transparency (OIT) which was introduced in QtQuick3D. Graphs tend to show a lot of overlapping items, especially in the case of 3D, so OIT support has resulted in improved visuals when transparency is used, and the data is understood more clearly.
Surface3D现在利用了QtQuick3D中引入的顺序无关透明度(OIT)。图表往往显示许多重叠的项目,特别是在3D的情况下,因此当使用透明度时,OIT支持可以改善视觉效果,并且可以更清楚地理解数据。
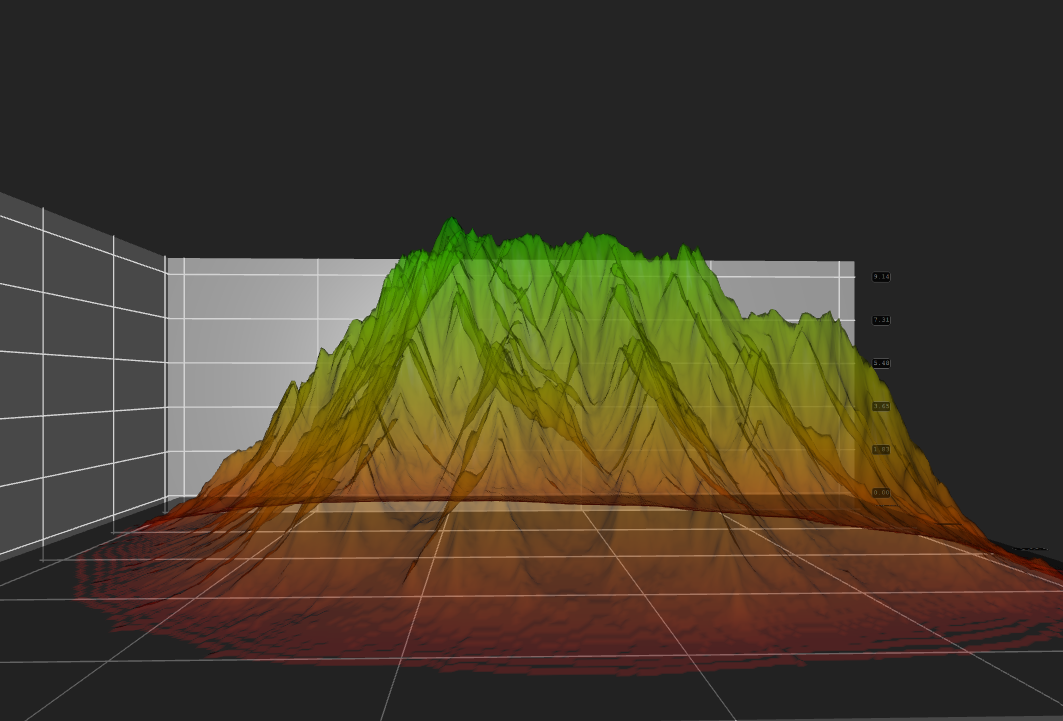
This graph is rendered using the Approximate OIT method.
此图表使用近似OIT方法渲染。
Updated Input Handling for Series
更新了系列的输入处理
As of 6.8, QtGraphs 2D only offered the "selectable" and "hoverable" properties for its series of graphs and individual clicks had to be implemented manually. Now, some more events have been added to match input handling as it was in QtCharts with the addition of "clicked", "doubleClicked", "pressed", and "released" signals.
截至6.8,QtGraphs 2D仅为其一系列图形提供了“可选”和“可移动”属性,并且必须手动执行单个点击。现在,添加了更多的事件来匹配QtCharts中的输入处理,添加了“clicked”、“doubleClicked”、“pressed”和“released”信号。
Spline Rendering for Scatter Graphs
散点图表的样条线渲染
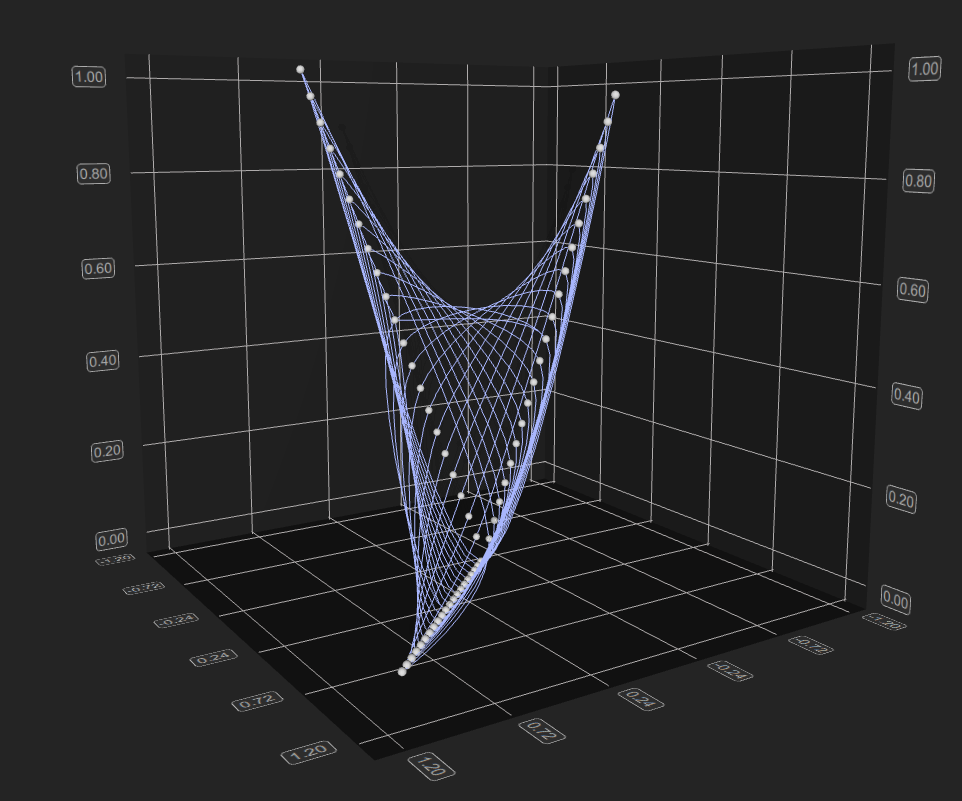
Spline graphs already exist in QtGraphs 2D, and now a 3D variation has been introduced for scatter graphs. It offers customizable resolution and dynamic updates. The image below shows how it's used to visualize the path between points.
样条图表已经存在于QtGraphs 2D中,现在为散点图表引入了3D变体。它提供可定制的分辨率和动态更新。下图显示了如何使用它来可视化点之间的路径。
Axis-Alignment Support in 2D Graphs
二维图表中的轴对齐支持
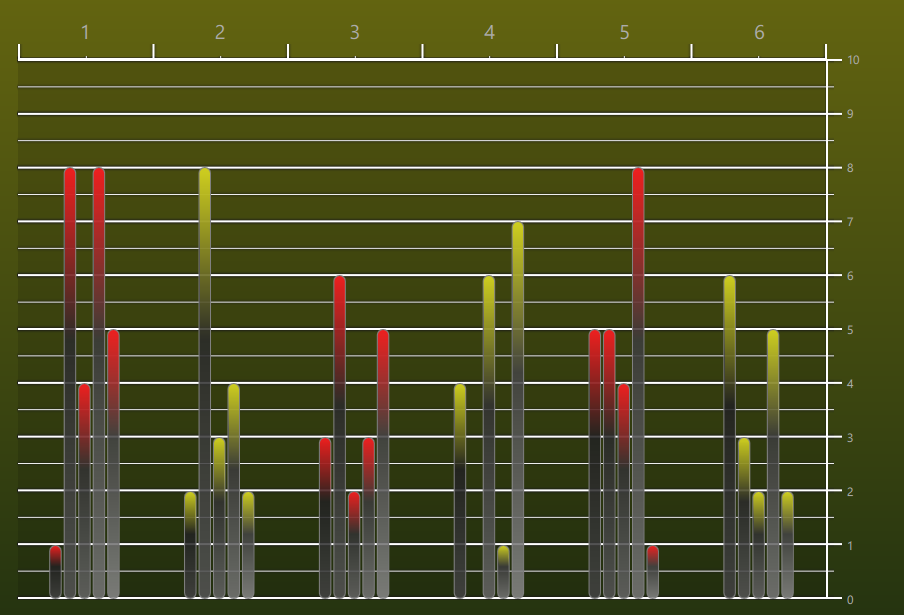
Usually when considering 2-dimensional graphs, the x-axis is displayed at the bottom and the y-axis is displayed on the left. In some cases, it might be more useful to have these axes on the adjacent sides of the graph. QtGraph 6.9 exposes another property called "alignment" which allows you to position the axis on one of these sides, the x-axis being either top or bottom and the y-axis being either left or right.
通常在考虑二维图表时,x轴显示在底部,y轴显示在左侧。在某些情况下,将这些轴放在图表的相邻边上可能更有用。QtGraph 6.9公开了另一个名为“alignment”的属性,它允许将轴定位在其中一侧,x轴是顶部或底部,y轴是左侧或右侧。
Panning and Zooming in 2D Graphs
二维图形中的平移和缩放
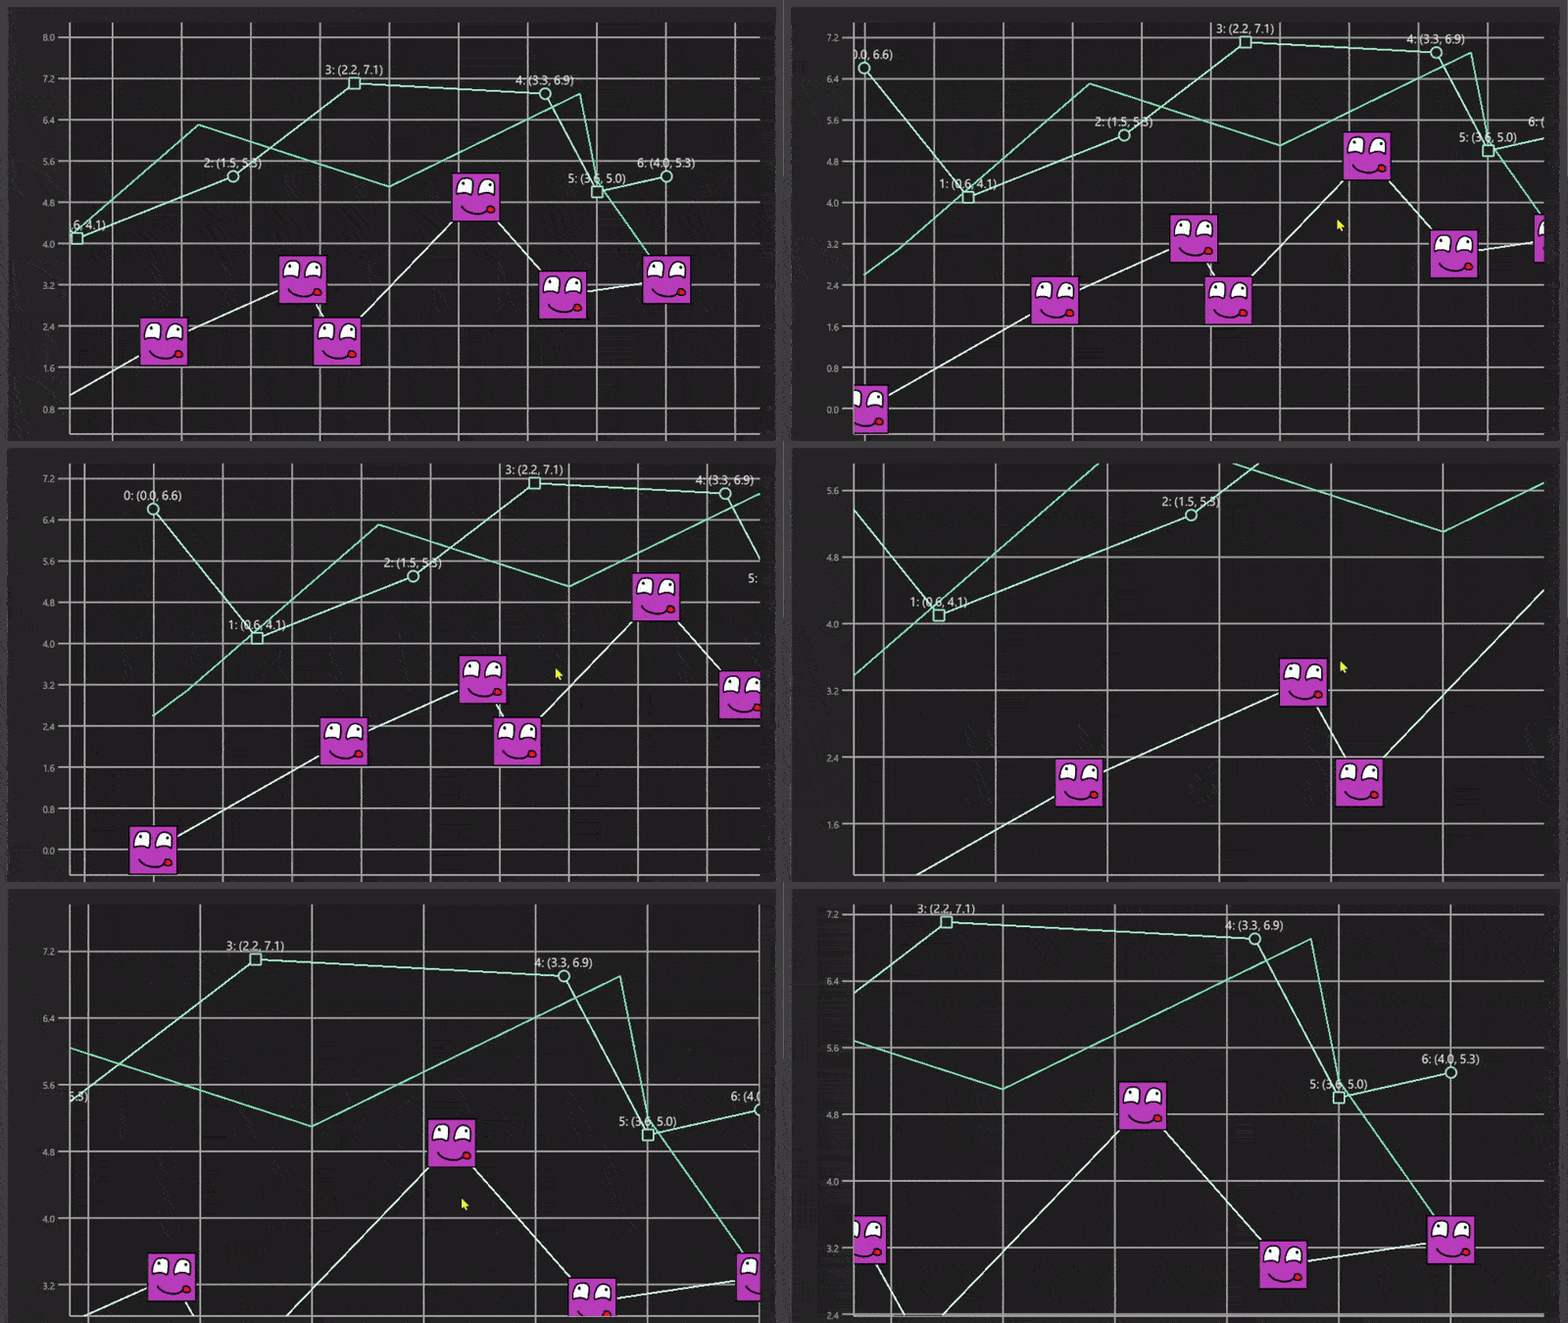
There are more exciting updates to 2D graphs: Panning and zooming functionality been added as shown in the clip below. Currently zoom works with respect to a point in the center and panning works with the familiar dragging action.
2D图表有更多令人兴奋的更新:添加了平移和缩放功能,如下图所示。目前,缩放是相对于中心的一个点进行的,平移是通过熟悉的拖动动作进行的。
In addition to these new components, there has been a magnitude of bug-fixes. Further development proceeds to squash out remaining bugs and to add requested features.
除了这些新组件,还修复了大量错误。进一步的开发将清除剩余的错误并添加所需的功能。


 扫一扫
扫一扫


 1687
1687

 被折叠的 条评论
为什么被折叠?
被折叠的 条评论
为什么被折叠?
 到【灌水乐园】发言


